Sibeesh Passion

Top Menu

  • Home
  • Search
  • About
  • Privacy Policy

Main Menu

  • Articles
    • Azure
    • .NET
    • IoT
    • JavaScript
    • Career Advice
    • Interview
    • Angular
    • Node JS
    • JQuery
    • Knockout JS
    • Jasmine Framework
    • SQL
    • MongoDB
    • MySQL
    • WordPress
  • Contributions
    • Medium
    • GitHub
    • Stack Overflow
    • Unsplash
    • ASP.NET Forum
    • C# Corner
    • Code Project
    • DZone
    • MSDN
  • Social Media
    • LinkedIn
    • Facebook
    • Instagram
    • Twitter
  • YouTube
    • Sibeesh Venu
    • Sibeesh Passion
  • Awards
  • Home
  • Search
  • About
  • Privacy Policy

logo

Sibeesh Passion

  • Articles
    • Azure
    • .NET
    • IoT
    • JavaScript
    • Career Advice
    • Interview
    • Angular
    • Node JS
    • JQuery
    • Knockout JS
    • Jasmine Framework
    • SQL
    • MongoDB
    • MySQL
    • WordPress
  • Contributions
    • Medium
    • GitHub
    • Stack Overflow
    • Unsplash
    • ASP.NET Forum
    • C# Corner
    • Code Project
    • DZone
    • MSDN
  • Social Media
    • LinkedIn
    • Facebook
    • Instagram
    • Twitter
  • YouTube
    • Sibeesh Venu
    • Sibeesh Passion
  • Awards
  • Linux Azure Function Isolated Dot Net 9 YAML Template Deployment

  • Build, Deploy, Configure CI &CD Your Static Website in 5 mins

  • Post Messages to Microsoft Teams Using Python

  • Get Azure Blob Storage Blob Metadata Using PowerShell

  • Deploy .net 6 App to Azure from Azure DevOps using Pipelines

HTML5
Home›HTML5›Client Side Chart Widget in HTML5: Part 5 (Polar Area Chart)

Client Side Chart Widget in HTML5: Part 5 (Polar Area Chart)

By SibeeshVenu
May 29, 2015
1278
0
Share:

Introduction

I hope you have read my first two articles in this series that explains the loading of a Bar Chart, Pie Chart and Doughnut Chart. Please see the following links.

  • Client-Side Chart Widget in HTML 5: Part 1 (Bar Chart)
  • Client-Side Chart Widget in HTML 5: Part 2 (Pie Chart)
  • Client-Side Chart Widget in HTML 5: Part 3 (Line Chart)
  • Client-Side Chart Widget in HTML5: Part 4 (Doughnut Chart)

Now we will explain a client-side Doughnut Chart widget in HTML5.

Background

Please download the necessary files here http://www.chartjs.org/.

Using the code

A simple HTML

  1. <!DOCTYPE html>
  2. <html xmlns=“http://www.w3.org/1999/xhtml”>
  3.    <head>
  4.        <title> Polar Area Chart Using Chart.js</title>
  5.    </head>
  6.    <body></body>
  7. </html>

Included JavaScript file

  1. <script src=“Chart.js”></script>

Call the Chart Function

  1. window.onload = function () {
  2.             var canvasObject = document.getElementById(“myChart”).getContext(“2d”);
  3.             window.myPolarArea = new Chart(canvasObject).PolarArea(polarChartData, {
  4.                 responsive: true
  5.             });
  6.         }

Here we are loading the chart in the myChart.

As you can see in the preceding code, polarChartData is the data we will load into the chart.

  1. var polarChartData = [
  2.     {
  3.         value: 200,
  4.         color: “#F7464A”,
  5.         highlight: “#FF5A5E”,
  6.         label: “Monday”
  7.     },
  8.     {
  9.         value: 50,
  10.         color: “#46BFBD”,
  11.         highlight: “#5AD3D1”,
  12.         label: “Tuesday”
  13.     },
  14.     {
  15.         value: 150,
  16.         color: “#FDB45C”,
  17.         highlight: “#FFC870”,
  18.         label: “Wednesday”
  19.     },
  20.     {
  21.         value: 20,
  22.         color: “#949FB1”,
  23.         highlight: “#A8B3C5”,
  24.         label: “Saturday”
  25.     },
  26.     {
  27.         value: 400,
  28.         color: “#4D5360”,
  29.         highlight: “#616774”,
  30.         label: “Sunday”
  31.     }
  32.                  ];

Properties

  • value
  • color
  • highlight
  • label

Here you can change the properties as you want.

Complete HTML

  1. <!DOCTYPE html>
  2. <html xmlns=“http://www.w3.org/1999/xhtml”>
  3. <head>
  4.     <title>Doughnut Chart Using Chart.js</title>
  5.     <script src=“Chart.js”></script>
  6.     <script>
  7.         var polarChartData = [
  8.                 {
  9.                     value: 200,
  10.                     color: “#F7464A”,
  11.                     highlight: “#FF5A5E”,
  12.                     label: “Monday”
  13.                 },
  14.                 {
  15.                     value: 50,
  16.                     color: “#46BFBD”,
  17.                     highlight: “#5AD3D1”,
  18.                     label: “Tuesday”
  19.                 },
  20.                 {
  21.                     value: 150,
  22.                     color: “#FDB45C”,
  23.                     highlight: “#FFC870”,
  24.                     label: “Wednesday”
  25.                 },
  26.                 {
  27.                     value: 20,
  28.                     color: “#949FB1”,
  29.                     highlight: “#A8B3C5”,
  30.                     label: “Saturday”
  31.                 },
  32.                 {
  33.                     value: 400,
  34.                     color: “#4D5360”,
  35.                     highlight: “#616774”,
  36.                     label: “Sunday”
  37.                 }
  38.         ];
  39.         window.onload = function () {
  40.             var canvasObject = document.getElementById(“myChart”).getContext(“2d”);
  41.             window.myPolarArea = new Chart(canvasObject).PolarArea(polarChartData, {
  42.                 responsive: true
  43.             });
  44.         }
  45.     </script>
  46. </head>
  47. <body>
  48.     <div>
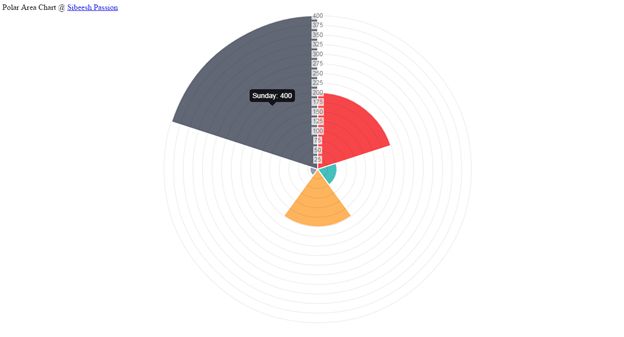
  49.         Polar Area Chart @ <a href=“www.sibeeshpassion.com”>Sibeesh Passion</a>
  50.         <canvas id=“myChart”></canvas>
  51.     </div>
  52. </body>
  53. </html>

Conclusion

I hope you can now create your own chart.

Output

Output

TagschartHTML5 ChartJQueryPolar Area Chart
Previous Article

Client Side Chart Widget in HTML 5: ...

Next Article

Solutions For Wamp Server Not Starting Issue

0
Shares
  • 0
  • +
  • 0
  • 0
  • 0

SibeeshVenu

I am Sibeesh Venu, an engineer by profession and writer by passion. Microsoft MVP, Author, Speaker, Content Creator, Youtuber, Programmer.

Related articles More from author

  • Export Hierarchical HTML Table
    CodeProjectJavaScriptJQuery

    Export Hierarchical (Multi-Level) HTML Table With Styles Using jQuery

    August 13, 2015
    By SibeeshVenu
  • jQuery Datatable With Server Side Data
    .NETAngularWeb API

    jQuery Datatable With Server Side Data

    February 25, 2016
    By SibeeshVenu
  • HTML5

    Client-Side Chart Widget in HTML5: Part 4 (Doughnut Chart)

    January 29, 2015
    By SibeeshVenu
  • Function Declaration And Function Expression
    CodeProjectJavaScriptJQuery

    Function Declaration And Function Expression

    October 21, 2015
    By SibeeshVenu
  • CodeProjectJQuery

    Loading or refreshing a div content uisng JQuery

    August 5, 2015
    By SibeeshVenu
  • Dogs Sharing Food
    CodeProjectJavaScriptJQuery

    jQuery no-conflict And Using Different Versions Of JQuery

    October 12, 2015
    By SibeeshVenu
0

My book

Asp Net Core and Azure with Raspberry Pi Sibeesh Venu

YouTube

MICROSOFT MVP (2016-2022)

profile for Sibeesh Venu - Microsoft MVP

Recent Posts

  • React Native Android Release with Azure DevOps and Google Play Store
  • Linux Azure Function Isolated Dot Net 9 YAML Template Deployment
  • Build, Deploy, Configure CI &CD Your Static Website in 5 mins
  • Easily move data from one COSMOS DB to another
  • .NET 8 New and Efficient Way to Check IP is in Given IP Range
  • Async Client IP safelist for Dot NET
  • Post Messages to Microsoft Teams Using Python
  • Get Azure Blob Storage Blob Metadata Using PowerShell
  • Deploy .net 6 App to Azure from Azure DevOps using Pipelines
  • Integrate Azure App Insights in 1 Minute to .Net6 Application

Tags

Achievements (35) Angular (14) Angular 5 (7) Angular JS (15) article (10) Article Of The Day (13) Asp.Net (14) Azure (65) Azure DevOps (10) Azure Function (10) Azure IoT (7) C# (17) c-sharp corner (13) Career Advice (11) chart (11) CSharp (7) CSS (7) CSS3 (6) HighChart (10) How To (9) HTML5 (10) HTML5 Chart (11) Interview (6) IoT (11) Javascript (10) JQuery (82) jquery functions (9) JQWidgets (15) JQX Grid (17) Json (7) Microsoft (8) MVC (20) MVP (9) MXChip (7) News (18) Office 365 (7) Products (10) SQL (20) SQL Server (15) Visual Studio (10) Visual Studio 2017 (7) VS2017 (7) Web API (12) Windows 10 (7) Wordpress (9)
  • .NET
  • Achievements
  • ADO.NET
  • Android
  • Angular
  • Arduino
  • Article Of The Day
  • ASP.NET
  • Asp.Net Core
  • Automobile
  • Awards
  • Azure
  • Azure CDN
  • azure devops
  • Blockchain
  • Blog
  • Browser
  • C-Sharp Corner
  • C#
  • Career Advice
  • Code Snippets
  • CodeProject
  • Cognitive Services
  • Cosmos DB
  • CSS
  • CSS3
  • Data Factory
  • Database
  • Docker
  • Drawings
  • Drill Down Chart
  • English
  • Excel Programming
  • Exporting
  • Facebook
  • Fun
  • Gadgets
  • GitHub
  • GoPro
  • High Map
  • HighChart
  • How to
  • HTML
  • HTML5
  • Ignite UI
  • IIS
  • Interview
  • IoT
  • JavaScript
  • JQuery
  • jQuery UI
  • JQWidgets
  • JQX Grid
  • Json
  • Knockout JS
  • Linux
  • Machine Learning
  • Malayalam
  • Malayalam Poems
  • MDX Query
  • Microsoft
  • Microsoft ADOMD
  • Microsoft MVP
  • Microsoft Office
  • Microsoft Technologies
  • Microsoft Windows
  • Microsoft Windows Server
  • Mobile
  • MongoDB
  • Monthly Winners
  • MVC
  • MVC Grid
  • MySQL
  • News
  • Node JS
  • npm
  • Number Conversions
  • October 2015
  • Office 365
  • Office Development
  • One Plus
  • Outlook
  • Page
  • PHP
  • Poems
  • PowerShell
  • Products
  • Q&A
  • Raspberry PI
  • React
  • SEO
  • SharePoint
  • Skype
  • Social Media
  • Software
  • Spire.Doc
  • Spire.PDF
  • Spire.XLS
  • SQL
  • SQL Server
  • SSAS
  • SSMS
  • Storage In HTML5
  • Stories
  • Third Party Software Apps
  • Tips
  • Tools
  • Translator Text
  • Uncategorized
  • Unit Testing
  • UWP
  • VB.Net
  • Videos
  • Virtual Machine
  • Visual Studio
  • Visual Studio 2017
  • Wamp Server
  • Web API
  • Web Platform Installer
  • Webinars
  • WebMatrix
  • Windows 10
  • Windows 7
  • Windows 8.1
  • Wordpress
  • Writing

ABOUT ME

I am Sibeesh Venu, an engineer by profession and writer by passion. Microsoft MVP, Author, Speaker, Content Creator, Youtuber, Programmer. If you would like to know more about me, you can read my story here.

Contact Me

  • info@sibeeshpassion.com

Pages

  • About
  • Search
  • Privacy Policy
  • About
  • Search
  • Privacy Policy
© Copyright Sibeesh Passion 2014-2025. All Rights Reserved.
Go to mobile version