Sibeesh Passion

Top Menu

  • Home
  • Search
  • About
  • Privacy Policy

Main Menu

  • Articles
    • Azure
    • .NET
    • IoT
    • JavaScript
    • Career Advice
    • Interview
    • Angular
    • Node JS
    • JQuery
    • Knockout JS
    • Jasmine Framework
    • SQL
    • MongoDB
    • MySQL
    • WordPress
  • Contributions
    • Medium
    • GitHub
    • Stack Overflow
    • Unsplash
    • ASP.NET Forum
    • C# Corner
    • Code Project
    • DZone
    • MSDN
  • Social Media
    • LinkedIn
    • Facebook
    • Instagram
    • Twitter
  • YouTube
    • Sibeesh Venu
    • Sibeesh Passion
  • Awards
  • Home
  • Search
  • About
  • Privacy Policy

logo

Sibeesh Passion

  • Articles
    • Azure
    • .NET
    • IoT
    • JavaScript
    • Career Advice
    • Interview
    • Angular
    • Node JS
    • JQuery
    • Knockout JS
    • Jasmine Framework
    • SQL
    • MongoDB
    • MySQL
    • WordPress
  • Contributions
    • Medium
    • GitHub
    • Stack Overflow
    • Unsplash
    • ASP.NET Forum
    • C# Corner
    • Code Project
    • DZone
    • MSDN
  • Social Media
    • LinkedIn
    • Facebook
    • Instagram
    • Twitter
  • YouTube
    • Sibeesh Venu
    • Sibeesh Passion
  • Awards
  • Linux Azure Function Isolated Dot Net 9 YAML Template Deployment

  • Build, Deploy, Configure CI &CD Your Static Website in 5 mins

  • Post Messages to Microsoft Teams Using Python

  • Get Azure Blob Storage Blob Metadata Using PowerShell

  • Deploy .net 6 App to Azure from Azure DevOps using Pipelines

HighChartHTML5JQuery
Home›Products›HighChart›Create a Combo Chart and Make Your Chart Draggable

Create a Combo Chart and Make Your Chart Draggable

By SibeeshVenu
April 29, 2015
1004
0
Share:

Introduction
Hi all, this article explains how to create a Combo chart. As you all know, the word combo is short for combination, in this case it is a combination of chart types. Which means we can have multiple chart types in one chart.

Background

For the past few months I have been working in a dashboard application, so I encountered a situation to work with a Combo chart in my application. As I began working with the Combo chart, when I finished the work I got a new requirement that a Pie chart must be draggable in the chart area. So I thought of working on that and share it with you all.

What we need first

Include the necessary JavaScript files and UI elements as follows.

  1. <script src=“http://code.highcharts.com/highcharts.js”></script>
  2. <script src=“http://code.highcharts.com/modules/exporting.js”></script>
  3. <div id=“container” style=“min-width: 310px; height: 400px; margin: 0 auto”></div>
  4. <div id=“container2” style=“width: 150px; height: 150px; margin: 0 auto; position:absolute; top: 120px; left: 150px;”></div>

Combo chart configuration

Our next step is to configure the Combo chart. You can determine the configuration here.

  1. $(function()
  2. {
  3.     $(‘#container’).highcharts({
  4.         title: {
  5.             text: ‘Worked hours in a week’
  6.         },
  7.         xAxis: {
  8.             categories: [‘Apples’, ‘Oranges’, ‘Pears’, ‘Bananas’, ‘Plums’]
  9.         },
  10.         series: [{
  11.             type: ‘column’,
  12.             name: ‘Monday’,
  13.             data: [3, 2, 1, 3, 4]
  14.         }, {
  15.             type: ‘column’,
  16.             name: ‘Tuesday’,
  17.             data: [2, 3, 5, 7, 6]
  18.         }, {
  19.             type: ‘column’,
  20.             name: ‘Wednesday’,
  21.             data: [4, 3, 3, 9, 0]
  22.         }, {
  23.             type: ‘column’,
  24.             name: ‘Thursday’,
  25.             data: [4, 3, 3, 9, 0]
  26.         }, {
  27.             type: ‘column’,
  28.             name: ‘Friday’,
  29.             data: [4, 3, 3, 9, 0]
  30.         }, {
  31.             type: ‘spline’,
  32.             name: ‘Thursday’,
  33.             data: [3, 2.67, 3, 6.33, 3.33],
  34.             marker: {
  35.                 lineWidth: 2,
  36.                 lineColor: Highcharts.getOptions().colors[3],
  37.                 fillColor: ‘white’
  38.             }
  39.         }]
  40.     });
  41.     $(‘#container2’).highcharts({
  42.         chart: {
  43.             backgroundColor: ‘rgba(0,0,0,0)’
  44.         },
  45.         title: {
  46.             text: null
  47.         },
  48.         exporting: {
  49.             enabled: false
  50.         },
  51.         credits: {
  52.             enabled: false
  53.         },
  54.         series: [{
  55.             type: ‘pie’,
  56.             name: ‘Total’,
  57.             data: [{
  58.                 name: ‘Monday’,
  59.                 y: 13,
  60.                 color: Highcharts.getOptions().colors[0]
  61.             }, {
  62.                 name: ‘Tuesday’,
  63.                 y: 23,
  64.                 color: Highcharts.getOptions().colors[1]
  65.             }, {
  66.                 name: ‘Wednesday’,
  67.                 y: 19,
  68.                 color: Highcharts.getOptions().colors[2]
  69.             }, {
  70.                 name: ‘Thursday’,
  71.                 y: 19,
  72.                 color: Highcharts.getOptions().colors[2]
  73.             }, {
  74.                 name: ‘Friday’,
  75.                 y: 19,
  76.                 color: Highcharts.getOptions().colors[2]
  77.             }],
  78.             size: 90,
  79.             showInLegend: false,
  80.             dataLabels: {
  81.                 enabled: false
  82.             }
  83.         }]
  84.     });
  85.     $(“#container2”).draggable();
  86. });

Please note that I have given the Pie chart as a separate chart so that we can make it draggable as follows.

  1. $(“#container2”).draggable();

You can determine the demo here: http://jsfiddle.net/sibeeshvenu/oc1mn8ru/4/

Output

Now if you run this configuration you will get output as follows.

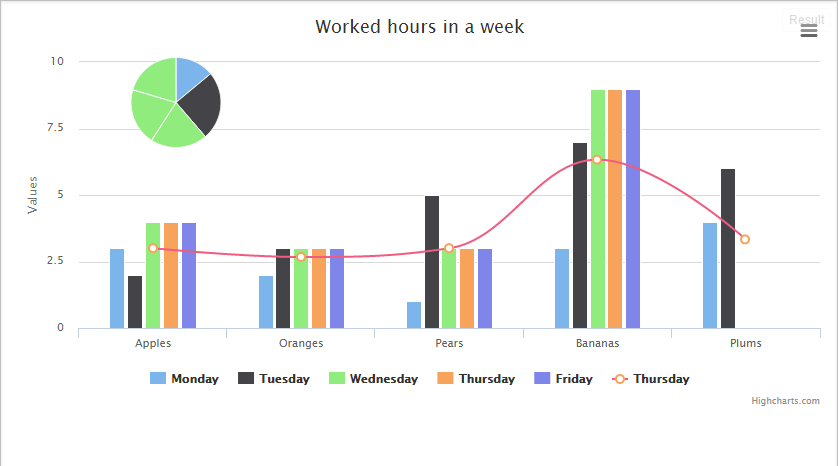
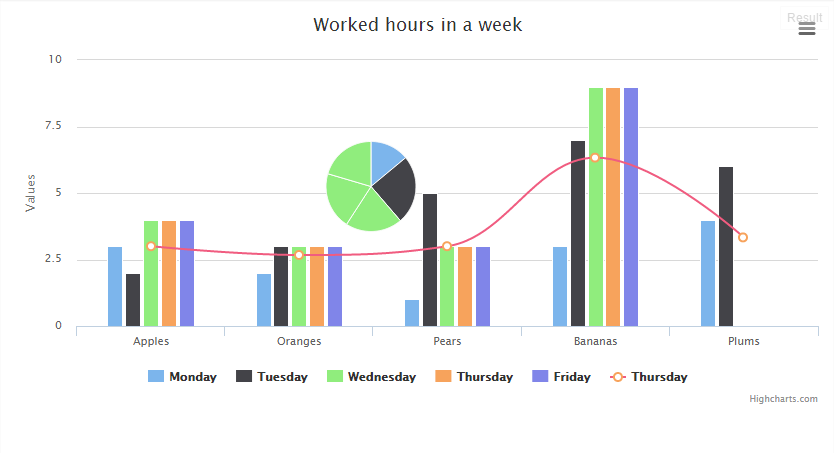
Now the interesting fact is, you can drag the pie to where ever you want it.

Conclusion

I hope you liked this article. Now please share your thoughts and suggestions. It matters a lot.

Kindest Regards,

Sibeesh Venu
Sibeesh Passion

TagschartCombo ChartDraggable ChartHTML5 ChartJQuery
Previous Article

Check Whether a Measure Group is Mapped ...

Next Article

Working With Charts

0
Shares
  • 0
  • +
  • 0
  • 0
  • 0

SibeeshVenu

I am Sibeesh Venu, an engineer by profession and writer by passion. Microsoft MVP, Author, Speaker, Content Creator, Youtuber, Programmer.

Related articles More from author

  • empty_project
    JavaScriptUnit Testing

    Writing JavaScript Tests Using Jasmine Framework

    October 10, 2016
    By SibeeshVenu
  • Code SnippetsJQuery

    Read appsetting from a web config file in client side

    May 31, 2015
    By SibeeshVenu
  • Code Snippets

    Selector to find elements which are all have a particular class name.

    May 31, 2015
    By SibeeshVenu
  • Code SnippetsJQuery

    How to forcibly call the change function of UI element in JQuery

    May 31, 2015
    By SibeeshVenu
  • CodeProjectJQuery

    Load Data on Scroll Using jQuery

    June 30, 2015
    By SibeeshVenu
  • Code SnippetsJQueryJson

    Parse a string to Json in JQuery

    May 31, 2015
    By SibeeshVenu
0

My book

Asp Net Core and Azure with Raspberry Pi Sibeesh Venu

YouTube

MICROSOFT MVP (2016-2022)

profile for Sibeesh Venu - Microsoft MVP

Recent Posts

  • Linux Azure Function Isolated Dot Net 9 YAML Template Deployment
  • Build, Deploy, Configure CI &CD Your Static Website in 5 mins
  • Easily move data from one COSMOS DB to another
  • .NET 8 New and Efficient Way to Check IP is in Given IP Range
  • Async Client IP safelist for Dot NET
  • Post Messages to Microsoft Teams Using Python
  • Get Azure Blob Storage Blob Metadata Using PowerShell
  • Deploy .net 6 App to Azure from Azure DevOps using Pipelines
  • Integrate Azure App Insights in 1 Minute to .Net6 Application
  • Azure DevOps Service Connection with Multiple Azure Resource Group

Tags

Achievements (35) Angular (14) Angular 5 (7) Angular JS (15) article (10) Article Of The Day (13) Asp.Net (14) Azure (65) Azure DevOps (10) Azure Function (10) Azure IoT (7) C# (17) c-sharp corner (13) Career Advice (11) chart (11) CSharp (7) CSS (7) CSS3 (6) HighChart (10) How To (9) HTML5 (10) HTML5 Chart (11) Interview (6) IoT (11) Javascript (10) JQuery (82) jquery functions (9) JQWidgets (15) JQX Grid (17) Json (7) Microsoft (8) MVC (20) MVP (9) MXChip (7) News (18) Office 365 (7) Products (10) SQL (20) SQL Server (15) Visual Studio (10) Visual Studio 2017 (7) VS2017 (7) Web API (12) Windows 10 (7) Wordpress (9)
  • .NET
  • Achievements
  • ADO.NET
  • Android
  • Angular
  • Arduino
  • Article Of The Day
  • ASP.NET
  • Asp.Net Core
  • Automobile
  • Awards
  • Azure
  • Azure CDN
  • azure devops
  • Blockchain
  • Blog
  • Browser
  • C-Sharp Corner
  • C#
  • Career Advice
  • Code Snippets
  • CodeProject
  • Cognitive Services
  • Cosmos DB
  • CSS
  • CSS3
  • Data Factory
  • Database
  • Docker
  • Drawings
  • Drill Down Chart
  • English
  • Excel Programming
  • Exporting
  • Facebook
  • Fun
  • Gadgets
  • GitHub
  • GoPro
  • High Map
  • HighChart
  • How to
  • HTML
  • HTML5
  • Ignite UI
  • IIS
  • Interview
  • IoT
  • JavaScript
  • JQuery
  • jQuery UI
  • JQWidgets
  • JQX Grid
  • Json
  • Knockout JS
  • Linux
  • Machine Learning
  • Malayalam
  • Malayalam Poems
  • MDX Query
  • Microsoft
  • Microsoft ADOMD
  • Microsoft MVP
  • Microsoft Office
  • Microsoft Technologies
  • Microsoft Windows
  • Microsoft Windows Server
  • Mobile
  • MongoDB
  • Monthly Winners
  • MVC
  • MVC Grid
  • MySQL
  • News
  • Node JS
  • npm
  • Number Conversions
  • October 2015
  • Office 365
  • Office Development
  • One Plus
  • Outlook
  • Page
  • PHP
  • Poems
  • PowerShell
  • Products
  • Q&A
  • Raspberry PI
  • React
  • SEO
  • SharePoint
  • Skype
  • Social Media
  • Software
  • Spire.Doc
  • Spire.PDF
  • Spire.XLS
  • SQL
  • SQL Server
  • SSAS
  • SSMS
  • Storage In HTML5
  • Stories
  • Third Party Software Apps
  • Tips
  • Tools
  • Translator Text
  • Uncategorized
  • Unit Testing
  • UWP
  • VB.Net
  • Videos
  • Virtual Machine
  • Visual Studio
  • Visual Studio 2017
  • Wamp Server
  • Web API
  • Web Platform Installer
  • Webinars
  • WebMatrix
  • Windows 10
  • Windows 7
  • Windows 8.1
  • Wordpress
  • Writing

ABOUT ME

I am Sibeesh Venu, an engineer by profession and writer by passion. Microsoft MVP, Author, Speaker, Content Creator, Youtuber, Programmer. If you would like to know more about me, you can read my story here.

Contact Me

  • info@sibeeshpassion.com

Pages

  • About
  • Search
  • Privacy Policy
  • About
  • Search
  • Privacy Policy
© Copyright Sibeesh Passion 2014-2025. All Rights Reserved.
Go to mobile version