How To Save the Zoom View of Our Map
Today we will learn how to save the zoom level of our map in our application. By this you can retain the zoomed view that the user sets so that it would be easier for users to identify things in our application.
Background
A few weeks ago I got the requirement to save the zoom level of the map. If you are new to the Bubble Map, please see here: Working with Bubble Map
Download Source Code
Using the code
I hope you have configured a Bubble Map in your application now. Now it is time to complete our new requirement. Now what we will do is to introduce a new function that retains the zoom level from the session storage and applies it to the map. You must call this function at the end of the map configuration.
The following is the function code.
[js]
var curMax = ”
var curMin = ”
var curMaxY = ”;
var curMinY = ”;
function updateZoom(chart) {
if (sessionStorage.getItem("curMaxZoomMap") != null && typeof sessionStorage.getItem("curMaxZoomMap") != ‘undefined’ && sessionStorage.getItem("curMinZoomMap") != null && typeof sessionStorage.getItem("curMinZoomMap") != ‘undefined’) {
chart.xAxis[0].setExtremes(parseInt(sessionStorage.getItem("curMinZoomMap")), parseInt(sessionStorage.getItem("curMaxZoomMap")));
}
if (sessionStorage.getItem("curMaxZoomMapY") != null && typeof sessionStorage.getItem("curMaxZoomMapY") != ‘undefined’ && sessionStorage.getItem("curMinZoomMapY") != null && typeof sessionStorage.getItem("curMinZoomMapY") != ‘undefined’) {
chart.yAxis[0].setExtremes(parseInt(sessionStorage.getItem("curMinZoomMapY")), parseInt(sessionStorage.getItem("curMaxZoomMapY")));
}
}
[/js]
Now we have seen how to apply the zoom level to the map. Next is how to set the value to the session storage. The fact is that whenever the user does zooming in the map, it fires events in xAxis and yAxis. So we need to crate that events in both axis.
Let’s look at that code now.
[js]
xAxis: {
events: {
afterSetExtremes: function (e) {
curMax = e.max;
curMin = e.min;
sessionStorage.setItem("curMaxZoomMap", curMax);
sessionStorage.setItem("curMinZoomMap", curMin);
}
}
},
yAxis: {
events: {
afterSetExtremes: function (e) {
curMaxY = e.max;
curMinY = e.min;
sessionStorage.setItem("curMaxZoomMapY", curMaxY);
sessionStorage.setItem("curMinZoomMapY", curMinY);
}
}
}
[/js]
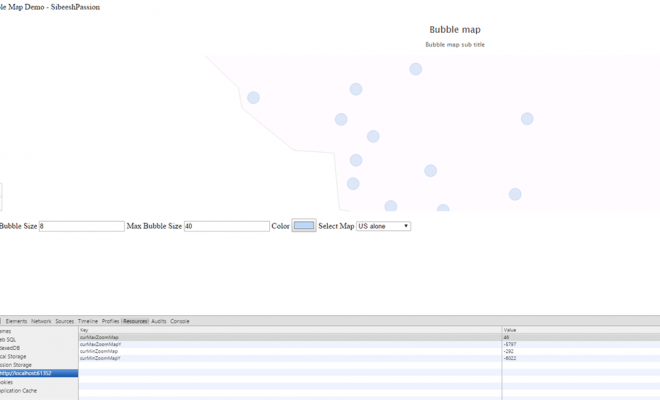
Once you have included this event you can see the values in session storage in your browser whenever the user zooms the map.
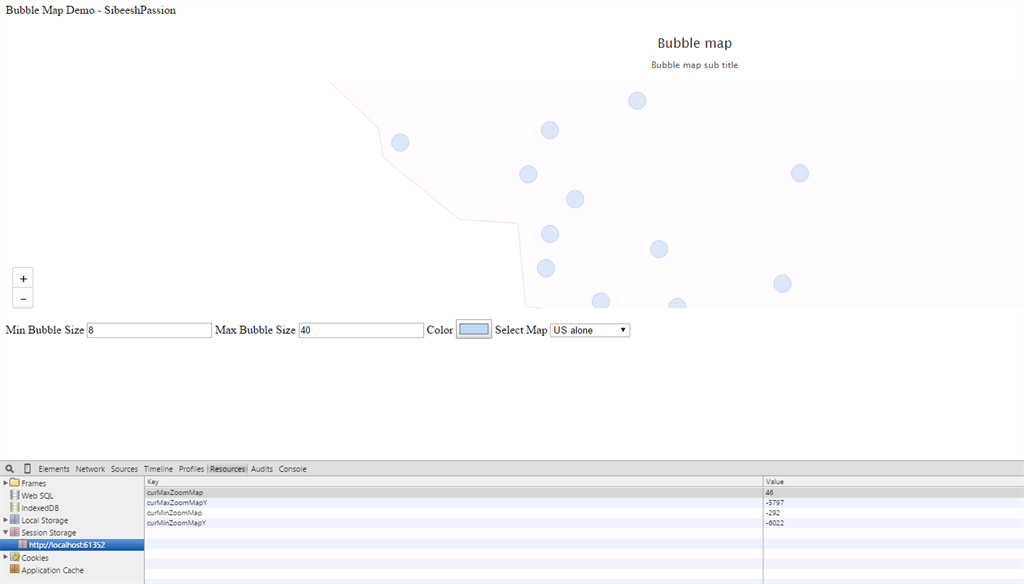
Save Zoomed View Of Bubble Map
Our next step is to include the zoomTo even in the series of our map.
[js]
events: {
click: function (e) {
e.point.zoomTo();
}
}
[/js]
So your series configuration will be as follows.
[js]
series: [{
mapData: map,
borderColor: ‘#E0E0E0’,
colour: ‘#E0E0E0’,
showInLegend: false,
enableMouseTracking: true,
cursor: ‘pointer’,
dataLabels: {
enabled: true,
format: ‘{point.properties.postal-code}’,
textDecoration: ‘none’,
style: { "color": "darkgrey", "fontWeight": "bold", "HcTextStroke": "0px rgba(0,0,0,0.5)" }
},
events: {
click: function (e) {
e.point.zoomTo();
}
},
}
[/js]
That is all guys, you can retain the zoom level of your map even if you reload. Cool!
Complete Code
[html]
<!DOCTYPE html>
<html xmlns="http://www.w3.org/1999/xhtml">
<head>
<title>Bubble Map Demo – sibeeshpassion</title>
<script src="Scripts/jquery-1.11.1.min.js"></script>
<script src="Scripts/highmaps.js"></script>
<script src="Scripts/proj4.js"></script>
<script src="Scripts/us-all.js"></script>
<script src="Scripts/world.js"></script>
<script>
var curMax = ”
var curMin = ”
var curMaxY = ”;
var curMinY = ”;
function updateZoom(chart) {
if (sessionStorage.getItem("curMaxZoomMap") != null && typeof sessionStorage.getItem("curMaxZoomMap") != ‘undefined’ && sessionStorage.getItem("curMinZoomMap") != null && typeof sessionStorage.getItem("curMinZoomMap") != ‘undefined’) {
chart.xAxis[0].setExtremes(parseInt(sessionStorage.getItem("curMinZoomMap")), parseInt(sessionStorage.getItem("curMaxZoomMap")));
}
if (sessionStorage.getItem("curMaxZoomMapY") != null && typeof sessionStorage.getItem("curMaxZoomMapY") != ‘undefined’ && sessionStorage.getItem("curMinZoomMapY") != null && typeof sessionStorage.getItem("curMinZoomMapY") != ‘undefined’) {
chart.yAxis[0].setExtremes(parseInt(sessionStorage.getItem("curMinZoomMapY")), parseInt(sessionStorage.getItem("curMaxZoomMapY")));
}
}
$(function () {
loadMap();
$(‘#apply’).click(function () {
loadMap();
});
});
function loadMap() {
var selectMap = $.trim($("#mapSelectMap").val());
var zPoint = "Quantity";
var jsdata = [{ "State": "Arizona", "lat": "32.8796", "lon": "-111.7282", "Quantity": "29,248" }, { "State": "Arizona", "lat": "33.3197", "lon": "-111.9837", "Quantity": "102,928" }, { "State": "Arizona", "lat": "33.3939", "lon": "-111.6965", "Quantity": "108,863" }, { "State": "Arizona", "lat": "33.4495", "lon": "-112.3410", "Quantity": "67,218" }, { "State": "Arizona", "lat": "33.6155", "lon": "-111.9263", "Quantity": "66,556" }, { "State": "Arizona", "lat": "33.6384", "lon": "-112.2073", "Quantity": "147,552" }, { "State": "California", "lat": "33.6145", "lon": "-117.7101", "Quantity": "26,053" }, { "State": "California", "lat": "33.7008", "lon": "-117.9362", "Quantity": "26,057" }, { "State": "California", "lat": "33.7963", "lon": "-116.3845", "Quantity": "497,249" }, { "State": "California", "lat": "33.8274", "lon": "-118.0868", "Quantity": "32,052" }, { "State": "California", "lat": "33.8763", "lon": "-117.7418", "Quantity": "23,521" }, { "State": "California", "lat": "33.8996", "lon": "-118.3669", "Quantity": "26,169" }, { "State": "California", "lat": "34.0302", "lon": "-118.3865", "Quantity": "21,996" }, { "State": "California", "lat": "34.0569", "lon": "-117.2995", "Quantity": "59,135" }, { "State": "California", "lat": "34.0737", "lon": "-117.8859", "Quantity": "4,757" }, { "State": "California", "lat": "34.1820", "lon": "-118.3140", "Quantity": "28,909" }, { "State": "California", "lat": "34.2257", "lon": "-119.1551", "Quantity": "22,569" }, { "State": "California", "lat": "34.2300", "lon": "-118.5500", "Quantity": "22,413" }, { "State": "California", "lat": "34.4130", "lon": "-118.5036", "Quantity": "18,399" }, { "State": "California", "lat": "34.4813", "lon": "-117.3389", "Quantity": "23,268" }, { "State": "California", "lat": "34.6029", "lon": "-118.1464", "Quantity": "24,651" }, { "State": "California", "lat": "37.5038", "lon": "-121.9762", "Quantity": "4" }, { "State": "California", "lat": "38.3525", "lon": "-122.7148", "Quantity": "2" }, { "State": "Colorado", "lat": "38.4766", "lon": "-107.8812", "Quantity": "3,294" }, { "State": "Colorado", "lat": "39.0730", "lon": "-108.5710", "Quantity": "8,704" }, { "State": "Florida", "lat": "27.8400", "lon": "-82.6800", "Quantity": "75,066" }, { "State": "Florida", "lat": "27.9400", "lon": "-82.3200", "Quantity": "135,365" }, { "State": "Florida", "lat": "27.9600", "lon": "-82.3200", "Quantity": "-6" }, { "State": "Florida", "lat": "27.9925", "lon": "-82.7296", "Quantity": "27,274" }, { "State": "Florida", "lat": "28.0661", "lon": "-82.5688", "Quantity": "261" }, { "State": "Florida", "lat": "28.0790", "lon": "-80.6984", "Quantity": "15,720" }, { "State": "Florida", "lat": "28.0941", "lon": "-81.9738", "Quantity": "85,437" }, { "State": "Florida", "lat": "28.1918", "lon": "-82.3812", "Quantity": "97,233" }, { "State": "Florida", "lat": "28.3027", "lon": "-81.4216", "Quantity": "135,193" }, { "State": "Florida", "lat": "28.5622", "lon": "-81.2074", "Quantity": "120,424" }, { "State": "Florida", "lat": "28.6629", "lon": "-81.4176", "Quantity": "110,185" }, { "State": "Florida", "lat": "29.1800", "lon": "-81.0800", "Quantity": "66,725" }, { "State": "Georgia", "lat": "32.8100", "lon": "-83.7100", "Quantity": "3" }, { "State": "Georgia", "lat": "33.3671", "lon": "-84.7647", "Quantity": "87,508" }, { "State": "Georgia", "lat": "33.4600", "lon": "-84.2100", "Quantity": "155,811" }, { "State": "Georgia", "lat": "33.4759", "lon": "-82.0709", "Quantity": "10,875" }, { "State": "Georgia", "lat": "33.5600", "lon": "-84.5400", "Quantity": "17,937" }, { "State": "Georgia", "lat": "33.5610", "lon": "-84.3223", "Quantity": "203,297" }, { "State": "Georgia", "lat": "33.6810", "lon": "-84.1604", "Quantity": "134,700" }, { "State": "Georgia", "lat": "33.8200", "lon": "-84.3600", "Quantity": "122,120" }, { "State": "Georgia", "lat": "33.9168", "lon": "-83.4439", "Quantity": "84,648" }, { "State": "Georgia", "lat": "33.9522", "lon": "-84.1343", "Quantity": "105,862" }, { "State": "Georgia", "lat": "34.0051", "lon": "-84.5752", "Quantity": "-14" }, { "State": "Georgia", "lat": "34.0076", "lon": "-84.5769", "Quantity": "204,888" }, { "State": "Georgia", "lat": "34.0600", "lon": "-83.9800", "Quantity": "104,291" }, { "State": "Georgia", "lat": "34.1900", "lon": "-84.1200", "Quantity": "186,459" }, { "State": "Idaho", "lat": "42.9101", "lon": "-112.4605", "Quantity": "5,524" }, { "State": "Idaho", "lat": "43.6048", "lon": "-116.3496", "Quantity": "14,476" }, { "State": "Illinois", "lat": "41.5300", "lon": "-87.8500", "Quantity": "54,989" }, { "State": "Illinois", "lat": "41.7200", "lon": "-88.0300", "Quantity": "72,366" }, { "State": "Illinois", "lat": "42.0500", "lon": "-87.8300", "Quantity": "59,164" }, { "State": "Illinois", "lat": "42.1000", "lon": "-87.9700", "Quantity": "49,074" }, { "State": "Illinois", "lat": "42.1300", "lon": "-88.3300", "Quantity": "77,454" }, { "State": "Illinois", "lat": "42.2300", "lon": "-87.9300", "Quantity": "51,251" }, { "State": "Illinois", "lat": "42.2600", "lon": "-88.9700", "Quantity": "57,571" }, { "State": "Indiana", "lat": "39.6292", "lon": "-86.1252", "Quantity": "24,227" }, { "State": "Indiana", "lat": "39.6303", "lon": "-86.1249", "Quantity": "1,074" }, { "State": "Indiana", "lat": "39.7613", "lon": "-86.3488", "Quantity": "12,319" }, { "State": "Indiana", "lat": "39.7634", "lon": "-86.3489", "Quantity": "1,027" }, { "State": "Indiana", "lat": "40.0028", "lon": "-86.1227", "Quantity": "901" }, { "State": "Indiana", "lat": "41.4900", "lon": "-87.4700", "Quantity": "83,677" }, { "State": "Kentucky", "lat": "38.1438", "lon": "-85.6751", "Quantity": "-85" }];
var data1 = [];
var tmp = ”;
var formatedVal = 0;
if (selectMap == "0") {
var H = Highcharts,
map = H.maps[‘countries/us/us-all’],
chart;
}
else {
var H = Highcharts,
map = H.maps[selectMap],
chart;
}
$.each(jsdata, function (ix, entry) {
if (Object.keys(entry).length >= 4) {
tmp = entry[zPoint].replace(/\,/g, ”).replace(/\$/g, ”).replace(/\%/g, ”).replace(/\(/g, ”).replace(/\)/g, ”);
if (isNaN(tmp)) {
entry.z = entry[zPoint];
}
else {
}
data1.push(entry);
}
});
chart = $(‘#container’).highcharts(‘Map’, {
chart: {
borderWidth: 1
},
title: {
text: ‘Bubble map’
},
subtitle: {
text: ‘Bubble map sub title’
},
tooltip: {
pointFormat: ‘{point.State}: {point.Quantity}’
},
mapNavigation: {
enabled: true,
buttonOptions: {
verticalAlign: ‘bottom’
}
},
xAxis: {
events: {
afterSetExtremes: function (e) {
curMax = e.max;
curMin = e.min;
sessionStorage.setItem("curMaxZoomMap", curMax);
sessionStorage.setItem("curMinZoomMap", curMin);
}
}
},
yAxis: {
events: {
afterSetExtremes: function (e) {
curMaxY = e.max;
curMinY = e.min;
sessionStorage.setItem("curMaxZoomMapY", curMaxY);
sessionStorage.setItem("curMinZoomMapY", curMinY);
}
}
},
legend: {
enabled: true,
title: {
style: {
color: (Highcharts.theme && Highcharts.theme.textColor) || ‘black’
}
},
layout: ‘vertical’,
align: ‘right’,
verticalAlign: ‘bottom’,
floating: true,
valueDecimals: 0,
valueSuffix: ‘$’,
backgroundColor: (Highcharts.theme && Highcharts.theme.legendBackgroundColor) || ‘rgba(255, 255, 255, 0.85)’,
symbolRadius: 0,
symbolHeight: 14
},
series: [{
mapData: map,
borderColor: ‘#E0E0E0’,
colour: ‘#E0E0E0’,
showInLegend: false,
enableMouseTracking: true,
cursor: ‘pointer’,
dataLabels: {
enabled: true,
format: ‘{point.properties.postal-code}’,
textDecoration: ‘none’,
style: { "color": "darkgrey", "fontWeight": "bold", "HcTextStroke": "0px rgba(0,0,0,0.5)" }
},
events: {
click: function (e) {
e.point.zoomTo();
}
},
},
{
type: ‘mapbubble’,
color: ‘#E0E0E0’,
dataLabels: {
enabled: true,
formatter: function () {
}
},
enableMouseTracking: true,
joinBy: [‘iso-a2’, ‘code’],
name: zPoint,
data: data1,
minSize: $("#mapMinBubSize").val(),
maxSize: $("#mapMaxBubSize").val(),
color: $("#mapColor").val(),
displayNegative: true,
sizeBy: ‘width’,
cursor: ‘pointer’,
negativeColor: Highcharts.getOptions().colors[0]
}
],
chart: {
marginRight: 50
},
exporting: {
enabled: false
}
}, function (chart) {
updateZoom(chart);
});
}
</script>
</head>
<body>
Bubble Map Demo – sibeeshpassion
<br />
<br />
<div id="container" style="min-width: 310px; height: 400px; margin: 0 auto"></div>
<label>Min Bubble Size</label>
<input type="number" value="8" min="1" id="mapMinBubSize" title="Type Bubble Min Size." />
<label>Max Bubble Size</label>
<input type="number" min="1" value="40" id="mapMaxBubSize" title="Type Bubble Max Size." />
<label>Color</label>
<input type="color" value="#BAD6F2" id="mapColor" title="Select Bubble Color." />
<label>Select Map</label>
<select name="tech" id="mapSelectMap" class="tech" title="Select Map.">
<option value="0">Select Map</option>
<option value="countries/us/us-all" selected="selected">US alone</option>
<option value="custom/world">Custom World</option>
</select>
<div id="apply" style="cursor: pointer; background-color: red; color: white; width: 100px; padding: 5px; float: right;">Apply Settings</div>
</body>
</html>
[/html]
Conclusion
Please download the source code for more details. I hope you liked this article. Now please share your thoughts and suggestions. It matters a lot.
Kindest Regards
Sibeesh Venu