Sibeesh Passion

Top Menu

  • Home
  • Communities
  • Search
  • About

Main Menu

  • Articles
    • Azure
    • JavaScript
    • Angular
    • Node JS
    • Web API
    • Career Advice
    • Interview
    • JQuery
    • Knockout JS
    • Jasmine Framework
    • Database
    • SQL
    • MongoDB
    • MySQL
    • Tools
    • IIS
    • Wamp Server
    • WordPress
    • Visual Studio
    • ASP.NET
    • MVC
    • PHP
    • SEO
    • HTML5
    • Office Development
  • Controls
    • HighChart
    • High Map
    • Ignite UI
      • igGrid
      • igDataChart
    • JQWidgets
      • JQX Grid
      • JQX List Box
    • Spire.Doc
    • Spire.XLS
  • My Contributions
    • Medium
    • ASP.NET Forum
    • C# Corner
    • Code Project
    • DZone
    • GitHub
    • JSFiddle
    • MSDN
    • Stack Overflow
  • Connect with Me
    • About Me
    • Facebook
    • Google Plus
    • Linkedin
    • Pinterest
    • Twitter
    • Quora
    • YouTube
  • Videos
  • Awards
  • SibeeshVenu.com
  • Home
  • Communities
  • Search
  • About

logo

Sibeesh Passion

  • Articles
    • Azure
    • JavaScript
    • Angular
    • Node JS
    • Web API
    • Career Advice
    • Interview
    • JQuery
    • Knockout JS
    • Jasmine Framework
    • Database
    • SQL
    • MongoDB
    • MySQL
    • Tools
    • IIS
    • Wamp Server
    • WordPress
    • Visual Studio
    • ASP.NET
    • MVC
    • PHP
    • SEO
    • HTML5
    • Office Development
  • Controls
    • Ignite_UI_Chart_Control

      Working With IgniteUI Chart igDataChart Control

      July 14, 2016
      0
    • Apply License Key

      Working With IgniteUI Grid Control

      July 10, 2016
      0
    • Grid with check box selection

      Implement radio button selection in JQWidgets JQXGrid using checkbox

      June 29, 2016
      0
    • High Chart

      Client Side Exporting In HighChart

      May 27, 2016
      0
    • Dynamically apply colour coding in Grid

      Dynamically Apply Colour Coding in Grid With Dynamic Headers And Data

      February 16, 2016
      0
    • Dynamically apply colour coding in Grid

      Remove Time Stamp Form Legend In HighChart

      January 25, 2016
      0
    • Select NuGet Package

      Using MVC Grid In MVC

      December 11, 2015
      0
    • Column values to a href

      a href Columns In Grid

      November 11, 2015
      0
    • Load Data On Scroll

      Load Data To Grid On Sroll

      November 2, 2015
      0
    • HighChart
    • High Map
    • Ignite UI
      • igGrid
      • igDataChart
    • JQWidgets
      • JQX Grid
      • JQX List Box
    • Spire.Doc
    • Spire.XLS
  • My Contributions
    • Medium
    • ASP.NET Forum
    • C# Corner
    • Code Project
    • DZone
    • GitHub
    • JSFiddle
    • MSDN
    • Stack Overflow
  • Connect with Me
    • About Me
    • Facebook
    • Google Plus
    • Linkedin
    • Pinterest
    • Twitter
    • Quora
    • YouTube
  • Videos
    • Bing Speech And Translate Text

      Webinar: Let us Build a Speech, Translation API using AZURE Bing Speech ...

      June 30, 2018
      0
    • Text Translator Api Thumbnail

      Video: Azure Cognitive Services Text Translator API

      June 30, 2018
      0
    • Bing Speech Api Thumbnail

      Video: Azure Cognitive Services - Bing Speech API

      June 30, 2018
      0
    • Video: 21 Easy Tips for Healthy Life

      February 22, 2018
      0
    • Azure Face API

      Webinar: Azure Cognitive Service Face API

      July 23, 2017
      0
    • Custom Stylish Handlebar Mirror in Royal Enfield Thunderbird

      June 25, 2017
      0
    • Wrapping Rope in Royal Enfield Crash Guard Or Bumper

      April 22, 2017
      0
    • How to Change Handlebar in Royal Enfield Thunderbird

      April 22, 2017
      0
    • Video: How to be a successful software engineer

      April 22, 2017
      0
  • Awards
  • SibeeshVenu.com
  • Create Your Own Cryptocurrency in Private Consortium Network Ethereum Azure Blockchain

  • Detect Noise Level Audio Decibels in MXChip Azure IoT DevKit

  • Deploy Angular App Using Azure DevOps Build and Release Pipelines

  • MXChip Device with Pressure, Humidity, Temperature Info using Azure IoT Workbench

  • Realtime IoT Data using Azure SignalR and Functions in Angular

ArticleHighChart
Home›Article›Working With Charts

Working With Charts

By SibeeshVenu
April 29, 2015
1245
0
Share:

Introduction

This tip says how to formulate our data as a High Chart. Please provide your valuable comments. 🙂

Background

I am working in a project where 80% of the processes are handled in the client side itself. So I was looking for a client-side chart and High Chart satisfied my requiremetns. It is a good plugin and also easy to use. What is High Chart? High Charts is solely based on native browser technologies and doesn’t require client-side plugins like Flash or Java. Furthermore you don’t need to install anything on your server. No PHP or ASP.NET. High Charts needs only two JavaScript files to run, the highcharts.js core and either the jQuery, MooTools, Prototype or High Charts Standalone framework. The High Charts Standalone framework is designed for those who do not already use jQuery, MooTools or Prototype in their web page and wish to use High Charts with minimal overhead. Read more here: HIGHCHARTS, HIGHSTOCK AND HIGHMAPS DOCUMENTATION.

What you must know

  1. jQuery :jQuery .
  2. JavaScript :W3Schools.com.
  3. CSS 3 : CSS3 Introduction .
  4. HTML :HTML(5) Tutorial .
  5. DOM Manipulations in jQuery :jQuery – DOM Manipulation .
Using the code

Before you start, you need to download the necessary files from: http://www.highcharts.com/download. Once you download the files, you need to include those in your project. Or you can use the CDN also.

<script src=“http://code.highcharts.com/highcharts.js”></script>
<script src=“http://code.highcharts.com/modules/heatmap.js”></script>
<script src=“http://code.highcharts.com/modules/exporting.js”></script>

Now it is time to add a UI element in which we will generate the chart. Please assign some width to that element, so that our chart can be formulated inside that element.

<div id=“container” style=“height: 400px; min-width: 310px; max-width: 800px; margin: 0 auto”></div>

Now what else is pending is only to add the script that does the formulation work as in the following:

$(function() {
    $(‘#container’).highcharts({
        chart: {
            type: ‘heatmap’,
            marginTop: 40,
            marginBottom: 40
        },
        title: {
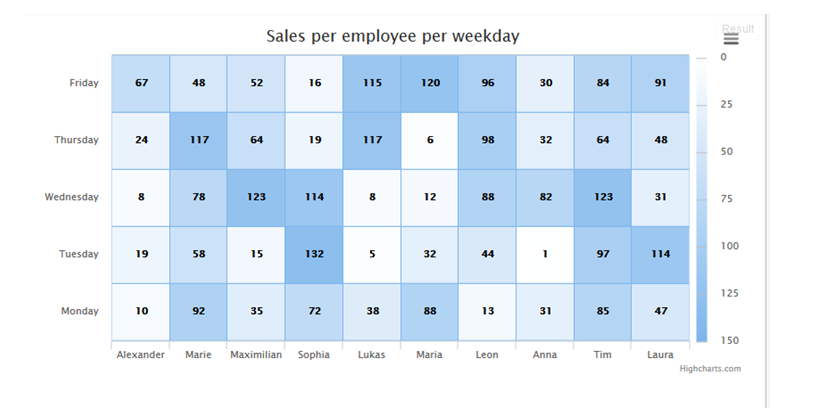
            text: ‘Sales per employee per weekday’
        },
        xAxis: {
            categories: [‘Alexander’, ‘Marie’, ‘Maximilian’, ‘Sophia’, ‘Lukas’, ‘Maria’, ‘Leon’, ‘Anna’, ‘Tim’, ‘Laura’]
        },
        yAxis: {
            categories: [‘Monday’, ‘Tuesday’, ‘Wednesday’, ‘Thursday’, ‘Friday’],
            title: null
        },
        colorAxis: {
            min: 0,
            minColor: ‘#FFFFFF’,
            maxColor: Highcharts.getOptions().colors[0]
        },
        legend: {
            align: ‘right’,
            layout: ‘vertical’,
            margin: 0,
            verticalAlign: ‘top’,
            y: 25,
            symbolHeight: 320
        },
        tooltip: {
            formatter: function() {
                return ‘<b>’
                this.series.xAxis.categories[this.point.x]
                ‘</b> sold <br><b>’
                this.point.value ‘</b> items on <br><b>’
                this.series.yAxis.categories[this.point.y]
                ‘</b>’;
            }
        },
        series: [{
            name: ‘Sales per employee’,
            borderWidth: 1,
            data: [
                [0, 0, 10],
                [0, 1, 19],
                [0, 2, 8],
                [0, 3, 24],
                [0, 4, 67],
                [1, 0, 92],
                [1, 1, 58],
                [1, 2, 78],
                [1, 3, 117],
                [1, 4, 48],
                [2, 0, 35],
                [2, 1, 15],
                [2, 2, 123],
                [2, 3, 64],
                [2, 4, 52],
                [3, 0, 72],
                [3, 1, 132],
                [3, 2, 114],
                [3, 3, 19],
                [3, 4, 16],
                [4, 0, 38],
                [4, 1, 5],
                [4, 2, 8],
                [4, 3, 117],
                [4, 4, 115],
                [5, 0, 88],
                [5, 1, 32],
                [5, 2, 12],
                [5, 3, 6],
                [5, 4, 120],
                [6, 0, 13],
                [6, 1, 44],
                [6, 2, 88],
                [6, 3, 98],
                [6, 4, 96],
                [7, 0, 31],
                [7, 1, 1],
                [7, 2, 82],
                [7, 3, 32],
                [7, 4, 30],
                [8, 0, 85],
                [8, 1, 97],
                [8, 2, 123],
                [8, 3, 64],
                [8, 4, 84],
                [9, 0, 47],
                [9, 1, 114],
                [9, 2, 31],
                [9, 3, 48],
                [9, 4, 91]
            ],
            dataLabels: {
                enabled: true,
                color: ‘black’,
                style: {
                    textShadow: ‘none’,
                    HcTextStroke: null
                }
            }
        }]
    });
});

Explanation

Now it’s time to go deeper to see what we have done. There are a few properties we have set for our chat so far. The following are what they are:

  • Chart: This property sets the chart type and chart styles. Here in this I am using heatmap. And you can set your own style to it.
  • Title: This sets the title for our chart. You can set a meaningful title related to our chart.
  • XAxis: Here you need to bind the series of elements that all you need to come under in X axis. You can bind that to the inner property categories.
  • YAxis: Here you need to bind the series of elements that all you need to come under in Y axis. You can bind that to the inner property categories.
  • ColorAxis: This property sets the colors for the chart. You can set the min color and max color so that we can get the shadow effect.
  • Legend: This is where we can set the limitation of which quadrant we need to show the data. You can set the y value to get the values as it’s multiplied one. You can also set its alignment.
  • Tooltip: Tooltip plays a main role in this chart, when you mouse over to the specific column you can see the small pop up that shows the exact value. You can set your own style for this J
  • Series: Now it’s time to apply the data. This is where we need to do that.
You can find more and do the options in this JavaScript fiddle.

Sibeeshvevenu

Output

Points of Interest

jQuery, CSS, HTML and HighChart.

History

1st Version: 08-May-2015

TagschartHigh Chart DemoHighCharthighchart sourceHTML5 Chartimplement highchartJQueryWorking with high chart
Previous Article

Create a Combo Chart and Make Your ...

Next Article

Implementing Nested Grid in JQWidget JQX Grid

0
Shares
  • 0
  • +
  • 0
  • 0
  • 0
  • 0

SibeeshVenu

I'm neither an expert nor a guru. I have been awarded Microsoft MVP 3times, C# Corner MVP 4 times, DZone MVB. I always love to learn new technologies, I believe the one who stops learning is old. You are always welcome to ask any doubts if you have any, I would be more than happy to help. Please feel free to follow me on any social media network, I really like to get connected with you.

Related articles More from author

  • ArticleHTML5

    Client-Side Chart Widget in HTML5: Part 4 (Doughnut Chart)

    January 29, 2015
    By SibeeshVenu
  • Code SnippetsJQuery

    Find a number from a string and remove in jQuery

    May 31, 2015
    By SibeeshVenu
  • Code SnippetsJQuery

    Get The Current URL in jQuery

    October 12, 2015
    By SibeeshVenu
  • ArticleCodeProjectJQuery

    Find And Exclude Element From Array

    August 5, 2015
    By SibeeshVenu
  • Make Image Fit To The Screen
    ArticleCodeProjectJavaScriptJQuery

    A Drag And Drop Game

    August 20, 2015
    By SibeeshVenu
  • JSON in Textarea
    ArticleHow toJQuery

    Style Or Format JSON Data In JQuery

    May 31, 2016
    By SibeeshVenu

Leave a reply Cancel reply

0

MICROSOFT MVP (3)

profile for Sibeesh Venu - Microsoft MVP

Recent Posts

  • Create Your Own Cryptocurrency in Private Consortium Network Ethereum Azure Blockchain
  • Detect Noise Level Audio Decibels in MXChip Azure IoT DevKit
  • Deploy Angular App Using Azure DevOps Build and Release Pipelines
  • MXChip Device with Pressure, Humidity, Temperature Info using Azure IoT Workbench
  • Realtime IoT Data using Azure SignalR and Functions in Angular
  • IoTHubTrigger Azure Function and Azure IoT Hub
  • Azure Function as Output Job Topology of an Azure Stream Analytics Job
  • Azure Stream Analytics Job and Tools for Visual Studio
  • An Introduction to Azure Stream Analytics Job
  • Raspberry PI SD Card Provisioning with Windows 10 IoT Core – Adding Packages to the Existing FFU Image

Archives

  • January 2019 (4)
  • December 2018 (6)
  • November 2018 (8)
  • October 2018 (5)
  • July 2018 (4)
  • June 2018 (4)
  • May 2018 (2)
  • April 2018 (3)
  • March 2018 (4)
  • February 2018 (4)
  • January 2018 (1)
  • December 2017 (3)
  • November 2017 (3)
  • October 2017 (1)
  • September 2017 (2)
  • July 2017 (3)
  • June 2017 (3)
  • May 2017 (7)
  • April 2017 (9)
  • March 2017 (9)
  • February 2017 (2)
  • January 2017 (4)
  • December 2016 (2)
  • November 2016 (2)
  • October 2016 (1)
  • August 2016 (1)
  • July 2016 (7)
  • June 2016 (9)
  • May 2016 (11)
  • April 2016 (6)
  • March 2016 (14)
  • February 2016 (15)
  • January 2016 (11)
  • December 2015 (8)
  • November 2015 (16)
  • October 2015 (22)
  • September 2015 (11)
  • August 2015 (20)
  • July 2015 (27)
  • June 2015 (35)
  • May 2015 (51)
  • April 2015 (10)
  • March 2015 (9)
  • January 2015 (17)
  • December 2014 (5)
  • November 2014 (2)
  • October 2014 (3)
  • August 2014 (1)
  • July 2014 (1)
  • December 2013 (1)

Categories

  • Achievements (34)
    • Microsoft MVP (1)
  • ADO.NET (1)
  • Android (1)
  • Angular (26)
  • Arduino (2)
  • Article (255)
  • Article Of The Day (3)
  • ASP.NET (35)
  • Asp.Net Core (2)
  • Automobile (5)
  • Awards (8)
  • Azure (34)
    • Azure CDN (1)
    • Cognitive Services (3)
      • Translator Text (1)
    • Virtual Machine (4)
  • Blockchain (1)
  • Blog (14)
  • Browser (1)
  • C-Sharp Corner (17)
    • Monthly Winners (1)
      • October 2015 (1)
  • C# (19)
  • Career Advice (10)
  • Code Snippets (53)
  • CodeProject (31)
  • CSS (6)
  • CSS3 (5)
  • Database (36)
    • MongoDB (5)
    • MySQL (3)
    • SQL (28)
      • SSAS (2)
    • SQL Server (11)
  • Docker (2)
  • Drawings (1)
  • Excel Programming (3)
  • Fun (1)
  • How to (35)
  • HTML (5)
  • HTML5 (18)
    • Storage In HTML5 (2)
  • IIS (3)
  • Interview (6)
  • IoT (11)
  • JavaScript (15)
  • JQuery (77)
    • Exporting (1)
    • jQuery UI (1)
  • Json (7)
  • Knockout JS (2)
  • Linux (1)
  • Machine Learning (1)
  • Microsoft (8)
    • Microsoft Windows Server (1)
    • Outlook (2)
    • Skype (1)
    • Web Platform Installer (1)
    • WebMatrix (1)
  • Microsoft ADOMD (7)
    • MDX Query (3)
  • Microsoft Office (7)
  • Microsoft Technologies (7)
    • Office Development (5)
  • Microsoft Windows (9)
    • Windows 10 (5)
    • Windows 7 (1)
    • Windows 8.1 (2)
  • Mobile (2)
  • Mobile Brands (1)
    • One Plus (1)
  • MVC (6)
  • News (12)
  • Node JS (5)
  • npm (1)
  • Number Conversions (1)
  • Page (1)
  • PHP (3)
  • Poems (1)
    • Malayalam Poems (1)
  • Products (36)
    • High Map (2)
    • HighChart (8)
      • Drill Down Chart (1)
    • Ignite UI (2)
    • JQWidgets (19)
      • JQX Grid (18)
    • MVC Grid (1)
    • Spire.Doc (1)
    • Spire.PDF (1)
    • Spire.XLS (2)
  • Q&A (7)
  • Raspberry PI (5)
  • React (2)
  • SEO (2)
  • SharePoint (2)
  • Social Media (1)
    • Facebook (1)
  • Software (1)
    • Third Party Software Apps (1)
  • Stories (6)
    • English (2)
    • Malayalam (3)
  • Tips (2)
  • Tools (19)
    • GitHub (1)
    • SSMS (1)
    • Visual Studio (12)
      • Visual Studio 2017 (8)
  • Uncategorized (1)
  • Unit Testing (2)
  • VB.Net (1)
  • Videos (17)
  • Wamp Server (3)
  • Web API (12)
  • Webinars (1)
  • Wordpress (9)

ABOUT ME

I am Sibeesh Venu, an engineer by profession and writer by passion. I’m neither an expert nor a guru. I have been awarded Microsoft MVP 3 times, C# Corner MVP 5 times, DZone MVB. I always love to learn new technologies, and I strongly believe that the one who stops learning is old.  If you would like to know more about me, you can read my story here.

Follow me

CONTACT ME

  • X 384 / A, Katrikkal House, Vembilly Post, Kunnathunadu Panchayat, Ernakulam - 683565, Kerala, India
  • 08893 08893 2
  • info@sibeeshpassion.com

Optin Form

Tags

Achievements ADOMD Angular Angular 5 Angular JS article Article Of The Day Asp.Net Azure Azure IoT C# c-sharp corner Career Advice chart CSharp CSS CSS3 HighChart How To HTML5 HTML5 Chart Interview IoT IoT Hub Javascript JQuery jquery functions JQWidgets JQX Grid Json Microsoft MVC MVP MXChip News Products SQL SQL Server Visual Studio Visual Studio 2017 VS2017 Web API Windows Windows 10 Wordpress
  • Home
  • About
  • Communities
  • Search
© Copyright Sibeesh Passion 2018-2019. All Rights Reserved.