Generate JSON According To Drill Down Drill Up Events
In this post, we will see how we can we generate or create JSON dynamically according to users drill up and drill down event actions. We will create JSON when user clicks on a drill down chart’s series. We will also learn how we will create a Drill Down Chart. With the help of created JSON we can get the information of which are all the series have been clicked by user or which are all the drill series have been seen by the user. We can do some more things with this JSON.
Background
For the past few weeks, I have been working with the High Chart. And I have got a chance to work with Drill Down chart in High Chart. After implement a drill down chart in my application successfully , I have got an another requirement of creating JSON dynamically according to the user’s drill down and drill up event action.
Practical Usage
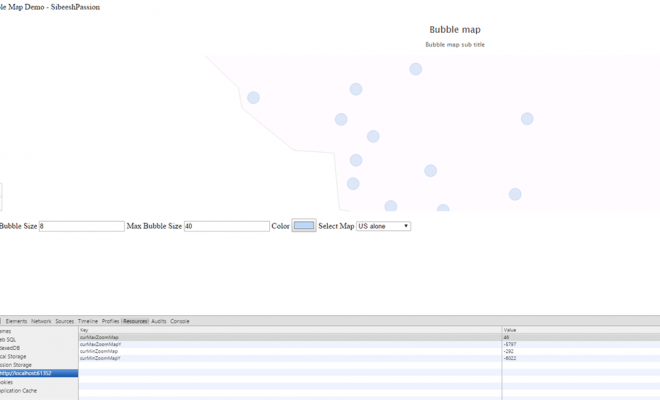
Hereby I am going to share the practical usage of the dynamically crated JSON. We have used this approach in our application. The task was simple but tough though. We have implemented a zooming functionality for each chart we have created. So we placed a zoom button above the chart. When user clicks the zoom button, a dialogue box will be opened with the drill down chart with maximum width and height. The problem we faced is, when user drill the chart to some level and click the zoom button, we were unable to maintain the same drill level in the the chart which is loaded in the dialogue box. Since this functionality was not available in the HighChart itself, We thought to do this our own. For this, we needed the drill level information in which user clicked. So we maintained the information in the format of JSON. And we take the values from this JSON while the new dialogue opens,and apply this to the chart.
Demo
You can see the demo here: Generate JSON According To Drill Down Drill Up Events – Sibeesh Passion
Using the code
The first thing we need to do is to load the required files.
[js]
<script src="http://sibeeshpassion.com/content/scripts/jquery-2.0.2.min.js"></script>
<script src="http://sibeeshpassion.com/content/scripts/highcharts.js"></script>
<script src="http://sibeeshpassion.com/content/scripts/drilldown.js"></script>
[/js]
Now we need the data for the chart right?
[js]
data: [{
name: ‘Fruits’,
y: 10,
drilldown: ‘fruits’
}, {
name: ‘Cars’,
y: 12,
drilldown: ‘cars’
}, {
name: ‘Countries’,
y: 8
}]
[/js]
Since we are creating a drill down chart, we need to set the drill down data also for the chart.
[js]
drilldown: {
series: [{
id: ‘fruits’,
name: ‘Fruits’,
data: [
[‘Apples’, 4],
[‘Pears’, 6],
[‘Oranges’, 2],
[‘Grapes’, 8]
]
}, {
id: ‘cars’,
name: ‘Cars’,
data: [{
name: ‘Toyota’,
y: 4,
drilldown: ‘toyota’
},
[‘Volkswagen’, 3],
[‘Opel’, 5]
]
}, {
id: ‘toyota’,
name: ‘Toyota’,
data: [
[‘RAV4’, 3],
[‘Corolla’, 1],
[‘Carina’, 4],
[‘Land Cruiser’, 5]
]
}]
}
[/js]
So we have set the data, now we need to set the complete options for our chart, we will set this in a variable.
[js]
var options = {
chart: {
height: 300,
events: {
drilldown: function (e) {
},
drillup: function (e) {
}
}
},
title: {
text: ‘Highcharts Drilldown Plugin’
},
xAxis: {
categories: true
},
drilldown: {
series: [{
id: ‘fruits’,
name: ‘Fruits’,
data: [
[‘Apples’, 4],
[‘Pears’, 6],
[‘Oranges’, 2],
[‘Grapes’, 8]
]
}, {
id: ‘cars’,
name: ‘Cars’,
data: [{
name: ‘Toyota’,
y: 4,
drilldown: ‘toyota’
},
[‘Volkswagen’, 3],
[‘Opel’, 5]
]
}, {
id: ‘toyota’,
name: ‘Toyota’,
data: [
[‘RAV4’, 3],
[‘Corolla’, 1],
[‘Carina’, 4],
[‘Land Cruiser’, 5]
]
}]
},
legend: {
enabled: false
},
plotOptions: {
series: {
dataLabels: {
enabled: true
},
shadow: false
},
pie: {
size: ‘80%’
}
},
series: [{
name: ‘Overview’,
colorByPoint: true,
data: [{
name: ‘Fruits’,
y: 10,
drilldown: ‘fruits’
}, {
name: ‘Cars’,
y: 12,
drilldown: ‘cars’
}, {
name: ‘Countries’,
y: 8
}]
}]
};
[/js]
Everything is set now, what else we need then? Yes we need to assign this option to our chart!.
[js]
// Drill Down Chart Implementation
options.chart.renderTo = ‘container’;
options.chart.type = ‘column’;
var chart1 = new Highcharts.Chart(options);
[/js]
As you can see in the above code, we are rendering the chart to a div called container. So we need to create a dv right?
[html]
<body>
Generate JSON According To Drill Down Drill Up Events – Sibeesh Passion (<a href="http://sibeeshpassion.com">Sibeesh Passion </a>)
<br/>
<br/>
<br/>
<div id="container" style="height: 300px"></div>
<div id="jsonContent"></div>
</body>
[/html]
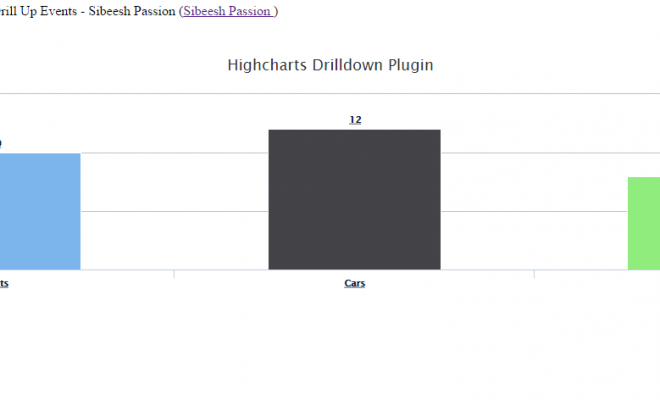
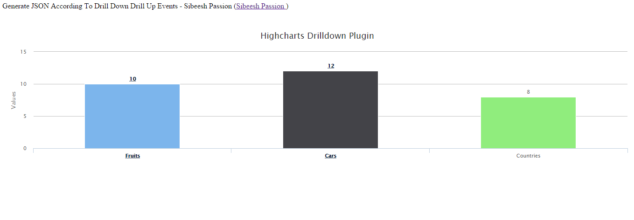
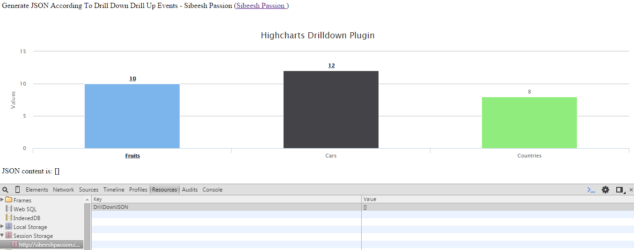
Now we are ready to run our chart. Shall we run it? If you run, you will get the output as follows.
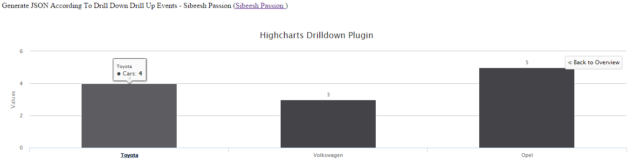
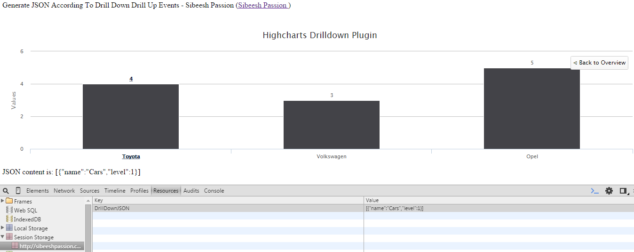
Now if you drill down to Cars you will get the below output.
It is time to create the JSON now. We will save the JSON value to sessionStorage. If you are new to sessionStorage and localStorage you can read it here: Storage Mechanism in HTML5
Once we assign the value to the storage, you can see that in browser console. We will also set this value to a div called jsonContent.
We will create a function for creating this JSON first.
[js]
function generateDrillDownJSON(e, isDrillUp) {
try {
if (isDrillUp) {
if (myJSON != null && myJSON.length > 0) {
removeArrayElementByIndex(myJSON, myJSON.length – 1);
}
sessionStorage.setItem(‘DrillDownJSON’, JSON.stringify(myJSON));
$("#jsonContent").html(‘JSON content is: ‘).append(JSON.stringify(myJSON));
} else {
myJSON.push({
name: e.point.name,
level: myJSON.length + 1,
});
sessionStorage.setItem(‘DrillDownJSON’, JSON.stringify(myJSON));
$("#jsonContent").html(‘JSON content is: ‘).append(JSON.stringify(myJSON));
}
} catch (e) {
console.log(‘generateHierarchyJSON :’ + e.message);
}
}
[/js]
As you can see we are handling the drill events in this function. If it is drill up event, we are removing the values from the JSON created. To remove, we are creating an another function.
[js]
function removeArrayElementByIndex(myArray, index) {
myArray.splice(index, 1);
}
[/js]
We will call our function generateDrillDownJSON in both drill down and drill up event.
[js]
events: {
drilldown: function (e) {
generateDrillDownJSON(e, false);
},
drillup: function (e) {
generateDrillDownJSON(e, true);
}
}
[/js]
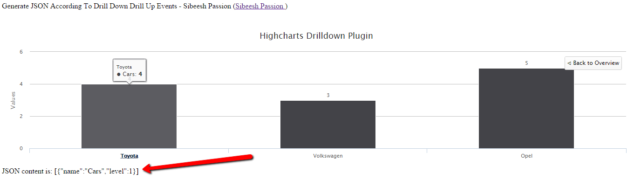
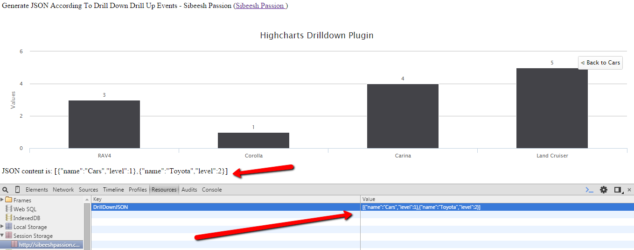
It is time to see our implementation and check whether it is working fine or not. So run your application now and click on the Cars series. You can see the JSON created in our div.
If you need to see the JSON value in the session storage, please click F12 and check in session storage.
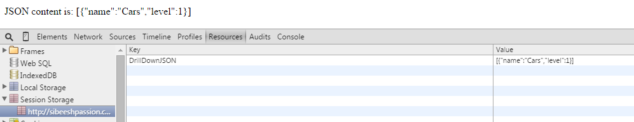
Now we will try the drill up event and check the JSON value.
You can see that while drill up, we are deleting those values from JSON.
Complete Code
[html]
<!DOCTYPE html>
<html>
<head>
<title>Generate JSON According To Drill Down Drill Up Events Demo-Sibeesh Passion</title>
<script src="http://sibeeshpassion.com/content/scripts/jquery-2.0.2.min.js"></script>
<script src="http://sibeeshpassion.com/content/scripts/highcharts.js"></script>
<script src="http://sibeeshpassion.com/content/scripts/drilldown.js"></script>
<script>
var myJSON = [];
$(document).ready(function () {
// Internationalization
Highcharts.setOptions({
lang: {
drillUpText: ‘◁ Back to {series.name}’
}
});
var options = {
chart: {
height: 300,
events: {
drilldown: function (e) {
generateDrillDownJSON(e, false);
},
drillup: function (e) {
generateDrillDownJSON(e, true);
}
}
},
title: {
text: ‘Highcharts Drilldown Plugin’
},
xAxis: {
categories: true
},
drilldown: {
series: [{
id: ‘fruits’,
name: ‘Fruits’,
data: [
[‘Apples’, 4],
[‘Pears’, 6],
[‘Oranges’, 2],
[‘Grapes’, 8]
]
}, {
id: ‘cars’,
name: ‘Cars’,
data: [{
name: ‘Toyota’,
y: 4,
drilldown: ‘toyota’
},
[‘Volkswagen’, 3],
[‘Opel’, 5]
]
}, {
id: ‘toyota’,
name: ‘Toyota’,
data: [
[‘RAV4’, 3],
[‘Corolla’, 1],
[‘Carina’, 4],
[‘Land Cruiser’, 5]
]
}]
},
legend: {
enabled: false
},
plotOptions: {
series: {
dataLabels: {
enabled: true
},
shadow: false
},
pie: {
size: ‘80%’
}
},
series: [{
name: ‘Overview’,
colorByPoint: true,
data: [{
name: ‘Fruits’,
y: 10,
drilldown: ‘fruits’
}, {
name: ‘Cars’,
y: 12,
drilldown: ‘cars’
}, {
name: ‘Countries’,
y: 8
}]
}]
};
// Drill Down Chart Implementation
options.chart.renderTo = ‘container’;
options.chart.type = ‘column’;
var chart1 = new Highcharts.Chart(options);
});
function generateDrillDownJSON(e, isDrillUp) {
try {
if (isDrillUp) {
if (myJSON != null && myJSON.length > 0) {
removeArrayElementByIndex(myJSON, myJSON.length – 1);
}
sessionStorage.setItem(‘DrillDownJSON’, JSON.stringify(myJSON));
$("#jsonContent").html(‘JSON content is: ‘).append(JSON.stringify(myJSON));
} else {
myJSON.push({
name: e.point.name,
level: myJSON.length + 1,
});
sessionStorage.setItem(‘DrillDownJSON’, JSON.stringify(myJSON));
$("#jsonContent").html(‘JSON content is: ‘).append(JSON.stringify(myJSON));
}
} catch (e) {
console.log(‘generateHierarchyJSON :’ + e.message);
}
}
function removeArrayElementByIndex(myArray, index) {
myArray.splice(index, 1);
}
</script>
</head>
<body>
Generate JSON According To Drill Down Drill Up Events – Sibeesh Passion (<a href="http://sibeeshpassion.com">Sibeesh Passion </a>)
<br/>
<br/>
<br/>
<div id="container" style="height: 300px"></div>
<div id="jsonContent"></div>
</body>
</html>
[/html]
Conclusion
I hope you liked my article. Please share me your valuable feedback and suggestions. Thanks in advance.
Kindest Regards
Sibeesh Venu
http://sibeeshpassion.com/