Client Side Chart Widget in HTML 5: Part 8 (Pie Chart With Custom ToolTip)
In this article we will see how to create a pie chart in HTML5 with custom tool tip. I hope you have read my first two articles in this series that explains the loading of Bar Charts, Pie Charts, Line Charts, Doughnut Charts, Polar Area Charts, Radar Charts and Line Chart with custom tooltip. Please see the following links.
Client-Side Chart Widget in HTML 5: Part 1 (Bar Chart)
Client-Side Chart Widget in HTML 5: Part 2 (Pie Chart)
Client-Side Chart Widget in HTML 5: Part 3 (Line Chart)
Client-Side Chart Widget in HTML 5: Part 4 (Doughnut Chart)
Client-Side Chart Widget in HTML 5: Part 5 (Polar Area Chart)
Client-Side Chart Widget in HTML 5: Part 6 (Radar Chart)
Client Side Chart Widget in HTML 5: Part 7 (Line Chart With Custom ToolTip)
Now we will explain a client Pie Chart widget with custom tooltip in HTML5.
Background
Please download the necessary files here.
Using the code
A simple HTML
[html]
<!DOCTYPE html>
<html xmlns="http://www.w3.org/1999/xhtml">
<head>
<title> Pie Chart widget with custom tooltip Using Chart.js</title>
</head>
<body></body>
</html>
[/html]
Included JavaScript file
[html]
<script src="Chart.js"></script>
<script src="http://cdnjs.cloudflare.com/ajax/libs/jquery/2.1.3/jquery.min.js"></script>
[/html]
Include UI Elements
[html]
<div id="canvas-holder">
<canvas id="chart-area1" width="50" height="50" />
</div>
<div id="canvas-holder">
<canvas id="chart-area2" width="300" height="300" />
</div>
<div id="chartjs-tooltip"></div>
[/html]
Call the Chart Function
[js]
window.onload = function () {
var ctx1 = document.getElementById("chart-area1").getContext("2d");
window.myPie = new Chart(ctx1).Pie(pieData);
var ctx2 = document.getElementById("chart-area2").getContext("2d");
window.myPie = new Chart(ctx2).Pie(pieData);
;
[/js]
Here we are loading the chart in the chart-area1 and chart-area2. As you can see in the preceding code, pieData is the data we will load into the chart.
[js]
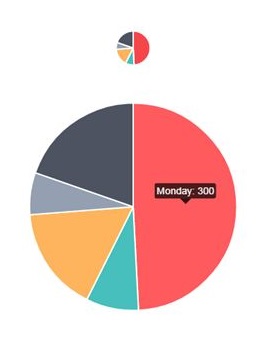
var pieData = [{
value: 300,
color: "#F7464A",
highlight: "#FF5A5E",
label: "Monday"
}, {
value: 50,
color: "#46BFBD",
highlight: "#5AD3D1",
label: "Tuesday"
}, {
value: 100,
color: "#FDB45C",
highlight: "#FFC870",
label: "Wednesday"
}, {
value: 40,
color: "#949FB1",
highlight: "#A8B3C5",
label: "Thursday"
}, {
value: 120,
color: "#4D5360",
highlight: "#616774",
label: "Friday"
}];
[/js]
Properties
Here you can change the properties as you want.
Now add the following style.
[css]
<style>
#canvas-holder {
width: 100%;
margin-top: 50px;
text-align: center;
}
#chartjs-tooltip {
opacity: 1;
position: absolute;
background: rgba(0, 0, 0, .7);
color: white;
padding: 3px;
border-radius: 3px;
-webkit-transition: all .1s ease;
transition: all .1s ease;
pointer-events: none;
-webkit-transform: translate(-50%, 0);
transform: translate(-50%, 0);
}
#chartjs-tooltip.below {
-webkit-transform: translate(-50%, 0);
transform: translate(-50%, 0);
}
#chartjs-tooltip.below:before {
border: solid;
border-color: #111 transparent;
border-color: rgba(0, 0, 0, .8) transparent;
border-width: 0 8px 8px 8px;
bottom: 1em;
content: "";
display: block;
left: 50%;
position: absolute;
z-index: 99;
-webkit-transform: translate(-50%, -100%);
transform: translate(-50%, -100%);
}
#chartjs-tooltip.above {
-webkit-transform: translate(-50%, -100%);
transform: translate(-50%, -100%);
}
#chartjs-tooltip.above:before {
border: solid;
border-color: #111 transparent;
border-color: rgba(0, 0, 0, .8) transparent;
border-width: 8px 8px 0 8px;
bottom: 1em;
content: "";
display: block;
left: 50%;
top: 100%;
position: absolute;
z-index: 99;
-webkit-transform: translate(-50%, 0);
transform: translate(-50%, 0);
}
</style>
[/css]
Load the tool tip
You can include the tool tip as follows.
[js]
Chart.defaults.global.customTooltips = function (tooltip) {
// Tooltip Element
var tooltipEl = $(‘#chartjs-tooltip’);
// Hide if no tooltip
if (!tooltip) {
tooltipEl.css({
opacity: 0
});
return;
}
// Set caret Position
tooltipEl.removeClass(‘above below’);
tooltipEl.addClass(tooltip.yAlign);
// Set Text
tooltipEl.html(tooltip.text);
// Find Y Location on page
var top;
if (tooltip.yAlign == ‘above’) {
top = tooltip.y – tooltip.caretHeight – tooltip.caretPadding;
} else {
top = tooltip.y + tooltip.caretHeight + tooltip.caretPadding;
}
// Display, position, and set styles for font
tooltipEl.css({
opacity: 1,
left: tooltip.chart.canvas.offsetLeft + tooltip.x + ‘px’,
top: tooltip.chart.canvas.offsetTop + top + ‘px’,
fontFamily: tooltip.fontFamily,
fontSize: tooltip.fontSize,
fontStyle: tooltip.fontStyle,
});
};
[/js]
Please note that you can change your tooltip as needed.
Complete Code
[html]
<!doctype html>
<html>
<head>
<title>Pie Chart with Custom Tooltips</title>
<script src="Chart.js"></script>
<script src="http://cdnjs.cloudflare.com/ajax/libs/jquery/2.1.3/jquery.min.js"></script>
<style>
#canvas-holder {
width: 100%;
margin-top: 50px;
text-align: center;
}
#chartjs-tooltip {
opacity: 1;
position: absolute;
background: rgba(0, 0, 0, .7);
color: white;
padding: 3px;
border-radius: 3px;
-webkit-transition: all .1s ease;
transition: all .1s ease;
pointer-events: none;
-webkit-transform: translate(-50%, 0);
transform: translate(-50%, 0);
}
#chartjs-tooltip.below {
-webkit-transform: translate(-50%, 0);
transform: translate(-50%, 0);
}
#chartjs-tooltip.below:before {
border: solid;
border-color: #111 transparent;
border-color: rgba(0, 0, 0, .8) transparent;
border-width: 0 8px 8px 8px;
bottom: 1em;
content: "";
display: block;
left: 50%;
position: absolute;
z-index: 99;
-webkit-transform: translate(-50%, -100%);
transform: translate(-50%, -100%);
}
#chartjs-tooltip.above {
-webkit-transform: translate(-50%, -100%);
transform: translate(-50%, -100%);
}
#chartjs-tooltip.above:before {
border: solid;
border-color: #111 transparent;
border-color: rgba(0, 0, 0, .8) transparent;
border-width: 8px 8px 0 8px;
bottom: 1em;
content: "";
display: block;
left: 50%;
top: 100%;
position: absolute;
z-index: 99;
-webkit-transform: translate(-50%, 0);
transform: translate(-50%, 0);
}
</style>
</head>
<body>
Pie Chart With Custom Tooltip @ <a href="www.sibeeshpassion.com">www.sibeeshpassion.com</a>
<div id="canvas-holder">
<canvas id="chart-area1" width="50" height="50" />
</div>
<div id="canvas-holder">
<canvas id="chart-area2" width="300" height="300" />
</div>
<div id="chartjs-tooltip"></div>
<script>
Chart.defaults.global.customTooltips = function (tooltip) {
// Tooltip Element
var tooltipEl = $(‘#chartjs-tooltip’);
// Hide if no tooltip
if (!tooltip) {
tooltipEl.css({
opacity: 0
});
return;
}
// Set caret Position
tooltipEl.removeClass(‘above below’);
tooltipEl.addClass(tooltip.yAlign);
// Set Text
tooltipEl.html(tooltip.text);
// Find Y Location on page
var top;
if (tooltip.yAlign == ‘above’) {
top = tooltip.y – tooltip.caretHeight – tooltip.caretPadding;
} else {
top = tooltip.y + tooltip.caretHeight + tooltip.caretPadding;
}
// Display, position, and set styles for font
tooltipEl.css({
opacity: 1,
left: tooltip.chart.canvas.offsetLeft + tooltip.x + ‘px’,
top: tooltip.chart.canvas.offsetTop + top + ‘px’,
fontFamily: tooltip.fontFamily,
fontSize: tooltip.fontSize,
fontStyle: tooltip.fontStyle,
});
};
var pieData = [{
value: 300,
color: "#F7464A",
highlight: "#FF5A5E",
label: "Monday"
}, {
value: 50,
color: "#46BFBD",
highlight: "#5AD3D1",
label: "Tuesday"
}, {
value: 100,
color: "#FDB45C",
highlight: "#FFC870",
label: "Wednesday"
}, {
value: 40,
color: "#949FB1",
highlight: "#A8B3C5",
label: "Thursday"
}, {
value: 120,
color: "#4D5360",
highlight: "#616774",
label: "Friday"
}];
window.onload = function () {
var ctx1 = document.getElementById("chart-area1").getContext("2d");
window.myPie = new Chart(ctx1).Pie(pieData);
var ctx2 = document.getElementById("chart-area2").getContext("2d");
window.myPie = new Chart(ctx2).Pie(pieData);
};
</script>
</body>
</html>
[/html]
Output

Pie Chart In HTML5
Conclusion
Did I miss anything that you may think which is needed? Could you find this post as useful? I hope you liked this article. Please share me your valuable suggestions and feedback.
Your turn. What do you think?
A blog isn’t a blog without comments, but do try to stay on topic. If you have a question unrelated to this post, you’re better off posting it on C# Corner, Code Project, Stack Overflow, Asp.Net Forum instead of commenting here. Tweet or email me a link to your question there and I’ll definitely try to help if I can.
Kindest Regards
Sibeesh Venu