Sibeesh Passion

Top Menu

  • Home
  • Search
  • About
  • Privacy Policy

Main Menu

  • Articles
    • Azure
    • .NET
    • IoT
    • JavaScript
    • Career Advice
    • Interview
    • Angular
    • Node JS
    • JQuery
    • Knockout JS
    • Jasmine Framework
    • SQL
    • MongoDB
    • MySQL
    • WordPress
  • Contributions
    • Medium
    • GitHub
    • Stack Overflow
    • Unsplash
    • ASP.NET Forum
    • C# Corner
    • Code Project
    • DZone
    • MSDN
  • Social Media
    • LinkedIn
    • Facebook
    • Instagram
    • Twitter
  • YouTube
    • Sibeesh Venu
    • Sibeesh Passion
  • Awards
  • Home
  • Search
  • About
  • Privacy Policy

logo

Sibeesh Passion

  • Articles
    • Azure
    • .NET
    • IoT
    • JavaScript
    • Career Advice
    • Interview
    • Angular
    • Node JS
    • JQuery
    • Knockout JS
    • Jasmine Framework
    • SQL
    • MongoDB
    • MySQL
    • WordPress
  • Contributions
    • Medium
    • GitHub
    • Stack Overflow
    • Unsplash
    • ASP.NET Forum
    • C# Corner
    • Code Project
    • DZone
    • MSDN
  • Social Media
    • LinkedIn
    • Facebook
    • Instagram
    • Twitter
  • YouTube
    • Sibeesh Venu
    • Sibeesh Passion
  • Awards
  • Linux Azure Function Isolated Dot Net 9 YAML Template Deployment

  • Build, Deploy, Configure CI &CD Your Static Website in 5 mins

  • Post Messages to Microsoft Teams Using Python

  • Get Azure Blob Storage Blob Metadata Using PowerShell

  • Deploy .net 6 App to Azure from Azure DevOps using Pipelines

HTML5
Home›HTML5›Client Side Chart Widget in HTML5: Part 6 (Radar Chart)

Client Side Chart Widget in HTML5: Part 6 (Radar Chart)

By SibeeshVenu
January 29, 2015
988
0
Share:

Introduction

I hope you have read my first two articles in this series that explains the loading of Bar Charts, Pie Charts, Line Charts, Doughnut Charts and Polar Area Charts. Please see the following links.

  • Client-Side Chart Widget in HTML 5: Part 1 (Bar Chart)
  • Client-Side Chart Widget in HTML 5: Part 2 (Pie Chart)
  • Client-Side Chart Widget in HTML 5: Part 3 (Line Chart)
  • Client-Side Chart Widget in HTML5: Part 4 (Doughnut Chart)
  • Client-Side Chart Widget in HTML5: Part 5 (Polar Area Chart)

Now we will explain a client Radar Chart widget in HTML5.

Background

Please download the necessary files here http://www.chartjs.org/.

Using the code

A simple HTML

  1. <!DOCTYPE html>
  2. <html xmlns=“http://www.w3.org/1999/xhtml”>
  3. <head>
  4.     <title> Radar Chart Using Chart.js</title>
  5. </head>
  6. <body></body>
  7. </html>

Included JavaScript file

  1. <script src=“Chart.js”></script>

Call the Chart Function

  1. window.onload = function () {
  2.     var canvasObject = document.getElementById(“myChart”).getContext(“2d”);
  3.     window.myRadar = new Chart(canvasObject).Radar(radarChartData, {
  4.         responsive: true
  5.     });
  6. }

Here we are loading the chart in the myChart.

As you can see in the preceding code, radarChartData is the data we will load into the chart.

  1. var radarChartData = {
  2.         labels: [“Monday”, “Tuesday”, “Wednesday”, “Thursday”, “Friday”, “Saturday”, “Sunday”],
  3.         datasets: [
  4.             {
  5.                 label: “Dataset 1”,
  6.                 fillColor: “#66FFFF”,
  7.                 strokeColor: “#800000”,
  8.                 pointColor: “rgba(220,220,220,1)”,
  9.                 pointStrokeColor: “#000”,
  10.                 pointHighlightFill: “#FF1919”,
  11.                 pointHighlightStroke: “rgba(220,220,220,1)”,
  12.                 data: [65, 59, 90, 81, 56, 55, 40]
  13.             },
  14.             {
  15.                 label: “Dataset 2”,
  16.                 fillColor: “#0033CC”,
  17.                 strokeColor: “#800000”,
  18.                 pointColor: “rgba(151,187,205,1)”,
  19.                 pointStrokeColor: “#000”,
  20.                 pointHighlightFill: “#FF1919”,
  21.                 pointHighlightStroke: “rgba(151,187,205,1)”,
  22.                 data: [28, 48, 40, 19, 96, 27, 100]
  23.             }
  24.         ]
  25.     };

Properties

  • Labels
  • Datasets
    1. label ( label for your dataset)
    2. fillColor
    3. strokeColor
    4. pointColor
    5. pointStrokeColor
    6. pointHighlightFill
    7. pointHighlightStroke
    8. data

Here you can change the properties as you want.

Complete HTML

  1. <!DOCTYPE html>
  2. <html xmlns=“http://www.w3.org/1999/xhtml”>
  3. <head>
  4.     <title>Radar Chart Using Chart.js</title>
  5.     <script src=“Chart.js”></script>
  6.     <script>
  7.         var radarChartData = {
  8.             labels: [“Monday”, “Tuesday”, “Wednesday”, “Thursday”, “Friday”, “Saturday”, “Sunday”],
  9.             datasets: [
  10.                 {
  11.                     label: “Dataset 1”,
  12.                     fillColor: “#66FFFF”,
  13.                     strokeColor: “#800000”,
  14.                     pointColor: “rgba(220,220,220,1)”,
  15.                     pointStrokeColor: “#000”,
  16.                     pointHighlightFill: “#FF1919”,
  17.                     pointHighlightStroke: “rgba(220,220,220,1)”,
  18.                     data: [65, 59, 90, 81, 56, 55, 40]
  19.                 },
  20.                 {
  21.                     label: “Dataset 2”,
  22.                     fillColor: “#0033CC”,
  23.                     strokeColor: “#800000”,
  24.                     pointColor: “rgba(151,187,205,1)”,
  25.                     pointStrokeColor: “#000”,
  26.                     pointHighlightFill: “#FF1919”,
  27.                     pointHighlightStroke: “rgba(151,187,205,1)”,
  28.                     data: [28, 48, 40, 19, 96, 27, 100]
  29.                 }
  30.             ]
  31.         };
  32.         window.onload = function () {
  33.             var canvasObject = document.getElementById(“myChart”).getContext(“2d”);
  34.             window.myRadar = new Chart(canvasObject).Radar(radarChartData, {
  35.                 responsive: true
  36.             });
  37.         }
  38.     </script>
  39. </head>
  40. <body>
  41.     <div>
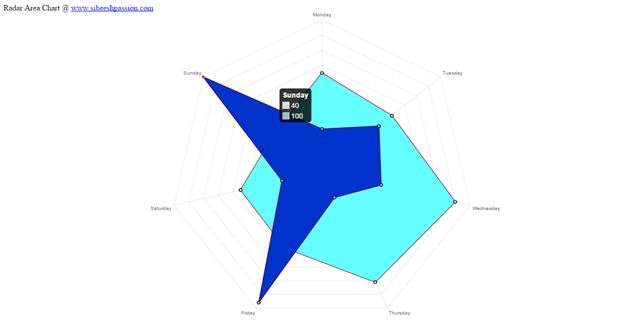
  42.         Radar Area Chart @ <a href=“www.sibeeshpassion.com”>www.sibeeshpassion.com</a>
  43.         <canvas id=“myChart”></canvas>
  44.     </div>
  45. </body>
  46. </html>

Conclusion

I hope you can now create your own chart.

Output

Radar Chart

TagschartHTML5 ChartJQueryRadar Chart
Previous Article

Client-Side Chart Widget in HTML5: Part 4 ...

Next Article

Things to Remember When You Write Or ...

0
Shares
  • 0
  • +
  • 0
  • 0
  • 0

SibeeshVenu

I am Sibeesh Venu, an engineer by profession and writer by passion. Microsoft MVP, Author, Speaker, Content Creator, Youtuber, Programmer.

Related articles More from author

  • Code SnippetsJQuery

    How to add a css class to an element in JQuery

    May 31, 2015
    By SibeeshVenu
  • Code SnippetsJQuery

    Check whether an array element is undefined or not in jQuery

    May 31, 2015
    By SibeeshVenu
  • How toJQuery

    How to make an event calls only once in JQuery

    June 22, 2015
    By SibeeshVenu
  • Code SnippetsJQuery

    Round Off the number to two decimal places in jQuery

    May 31, 2015
    By SibeeshVenu
  • Code SnippetsJQuery

    Make Last Option As Selected In Select,Drop Down,Combo Box

    August 25, 2015
    By SibeeshVenu
  • Change Page Layout Dynamically
    How toJQuery

    Change Page Layout Dynamically Using jQuery Layout Plug in

    February 22, 2016
    By SibeeshVenu
0

My book

Asp Net Core and Azure with Raspberry Pi Sibeesh Venu

YouTube

MICROSOFT MVP (2016-2022)

profile for Sibeesh Venu - Microsoft MVP

Recent Posts

  • Linux Azure Function Isolated Dot Net 9 YAML Template Deployment
  • Build, Deploy, Configure CI &CD Your Static Website in 5 mins
  • Easily move data from one COSMOS DB to another
  • .NET 8 New and Efficient Way to Check IP is in Given IP Range
  • Async Client IP safelist for Dot NET
  • Post Messages to Microsoft Teams Using Python
  • Get Azure Blob Storage Blob Metadata Using PowerShell
  • Deploy .net 6 App to Azure from Azure DevOps using Pipelines
  • Integrate Azure App Insights in 1 Minute to .Net6 Application
  • Azure DevOps Service Connection with Multiple Azure Resource Group

Tags

Achievements (35) Angular (14) Angular 5 (7) Angular JS (15) article (10) Article Of The Day (13) Asp.Net (14) Azure (65) Azure DevOps (10) Azure Function (10) Azure IoT (7) C# (17) c-sharp corner (13) Career Advice (11) chart (11) CSharp (7) CSS (7) CSS3 (6) HighChart (10) How To (9) HTML5 (10) HTML5 Chart (11) Interview (6) IoT (11) Javascript (10) JQuery (82) jquery functions (9) JQWidgets (15) JQX Grid (17) Json (7) Microsoft (8) MVC (20) MVP (9) MXChip (7) News (18) Office 365 (7) Products (10) SQL (20) SQL Server (15) Visual Studio (10) Visual Studio 2017 (7) VS2017 (7) Web API (12) Windows 10 (7) Wordpress (9)
  • .NET
  • Achievements
  • ADO.NET
  • Android
  • Angular
  • Arduino
  • Article Of The Day
  • ASP.NET
  • Asp.Net Core
  • Automobile
  • Awards
  • Azure
  • Azure CDN
  • azure devops
  • Blockchain
  • Blog
  • Browser
  • C-Sharp Corner
  • C#
  • Career Advice
  • Code Snippets
  • CodeProject
  • Cognitive Services
  • Cosmos DB
  • CSS
  • CSS3
  • Data Factory
  • Database
  • Docker
  • Drawings
  • Drill Down Chart
  • English
  • Excel Programming
  • Exporting
  • Facebook
  • Fun
  • Gadgets
  • GitHub
  • GoPro
  • High Map
  • HighChart
  • How to
  • HTML
  • HTML5
  • Ignite UI
  • IIS
  • Interview
  • IoT
  • JavaScript
  • JQuery
  • jQuery UI
  • JQWidgets
  • JQX Grid
  • Json
  • Knockout JS
  • Linux
  • Machine Learning
  • Malayalam
  • Malayalam Poems
  • MDX Query
  • Microsoft
  • Microsoft ADOMD
  • Microsoft MVP
  • Microsoft Office
  • Microsoft Technologies
  • Microsoft Windows
  • Microsoft Windows Server
  • Mobile
  • MongoDB
  • Monthly Winners
  • MVC
  • MVC Grid
  • MySQL
  • News
  • Node JS
  • npm
  • Number Conversions
  • October 2015
  • Office 365
  • Office Development
  • One Plus
  • Outlook
  • Page
  • PHP
  • Poems
  • PowerShell
  • Products
  • Q&A
  • Raspberry PI
  • React
  • SEO
  • SharePoint
  • Skype
  • Social Media
  • Software
  • Spire.Doc
  • Spire.PDF
  • Spire.XLS
  • SQL
  • SQL Server
  • SSAS
  • SSMS
  • Storage In HTML5
  • Stories
  • Third Party Software Apps
  • Tips
  • Tools
  • Translator Text
  • Uncategorized
  • Unit Testing
  • UWP
  • VB.Net
  • Videos
  • Virtual Machine
  • Visual Studio
  • Visual Studio 2017
  • Wamp Server
  • Web API
  • Web Platform Installer
  • Webinars
  • WebMatrix
  • Windows 10
  • Windows 7
  • Windows 8.1
  • Wordpress
  • Writing

ABOUT ME

I am Sibeesh Venu, an engineer by profession and writer by passion. Microsoft MVP, Author, Speaker, Content Creator, Youtuber, Programmer. If you would like to know more about me, you can read my story here.

Contact Me

  • info@sibeeshpassion.com

Pages

  • About
  • Search
  • Privacy Policy
  • About
  • Search
  • Privacy Policy
© Copyright Sibeesh Passion 2014-2025. All Rights Reserved.
Go to mobile version