Sibeesh Passion

Top Menu

  • Home
  • Search
  • About
  • Privacy Policy

Main Menu

  • Articles
    • Azure
    • .NET
    • IoT
    • JavaScript
    • Career Advice
    • Interview
    • Angular
    • Node JS
    • JQuery
    • Knockout JS
    • Jasmine Framework
    • SQL
    • MongoDB
    • MySQL
    • WordPress
  • Contributions
    • Medium
    • GitHub
    • Stack Overflow
    • Unsplash
    • ASP.NET Forum
    • C# Corner
    • Code Project
    • DZone
    • MSDN
  • Social Media
    • LinkedIn
    • Facebook
    • Instagram
    • Twitter
  • YouTube
    • Sibeesh Venu
    • Sibeesh Passion
  • Awards
  • Home
  • Search
  • About
  • Privacy Policy

logo

Sibeesh Passion

  • Articles
    • Azure
    • .NET
    • IoT
    • JavaScript
    • Career Advice
    • Interview
    • Angular
    • Node JS
    • JQuery
    • Knockout JS
    • Jasmine Framework
    • SQL
    • MongoDB
    • MySQL
    • WordPress
  • Contributions
    • Medium
    • GitHub
    • Stack Overflow
    • Unsplash
    • ASP.NET Forum
    • C# Corner
    • Code Project
    • DZone
    • MSDN
  • Social Media
    • LinkedIn
    • Facebook
    • Instagram
    • Twitter
  • YouTube
    • Sibeesh Venu
    • Sibeesh Passion
  • Awards
  • Linux Azure Function Isolated Dot Net 9 YAML Template Deployment

  • Build, Deploy, Configure CI &CD Your Static Website in 5 mins

  • Post Messages to Microsoft Teams Using Python

  • Get Azure Blob Storage Blob Metadata Using PowerShell

  • Deploy .net 6 App to Azure from Azure DevOps using Pipelines

HTML
Home›HTML›Client Side Chart Widget in HTML 5: Part 3 (Line Chart)

Client Side Chart Widget in HTML 5: Part 3 (Line Chart)

By SibeeshVenu
May 29, 2015
1024
0
Share:

Introduction

I hope you have read my first two articles in this series that explains about loading a Bar chart and Pie chart. If you have not read them then please see the following links.

  • Client-Side Chart Widget in HTML 5: Part 1 (Bar Chart)
  • Client-Side Chart Widget in HTML 5: Part 2 (Pie Chart)

Now we will explain a client-side line chart widget in HTML5.

Background

Please download the necessary files here.

Using the code

A simple HTML

  1. <!DOCTYPE html>
  2. <html xmlns=“http://www.w3.org/1999/xhtml”>
  3. <head>
  4.     <title>Line Chart Using Chart.js</title>
  5. </head>
  6. <body></body>
  7. </html>

Included JavaScript file

  1. <script src=“Chart.js”></script>

Call the Chart Function

  1. window.onload = function () {
  2.         var canvasObject = document.getElementById(“myChart”).getContext(“2d”);
  3.         window.myLine = new Chart(canvasObject).Line(lineChartData, {
  4.             responsive: true
  5.         });
  6.     }

Here we are loading the chart into myChart.

As you can see in the preceding code, lineChartData is the data we will load into the chart.

  1. var lineChartData = {
  2.         labels: [“Monday”, “Tuesday”, “Wednesday”, “Thursday”, “Friday”, “Saturday”, “Sunday”],
  3.         datasets: [
  4.                 {
  5.                     label: “My First dataset”,
  6.                     fillColor: “rgba(220,220,220,0.2)”,
  7.                     strokeColor: “rgba(220,220,220,1)”,
  8.                     pointColor: “rgba(220,220,220,1)”,
  9.                     pointStrokeColor: “#fff”,
  10.                     pointHighlightFill: “#fff”,
  11.                     pointHighlightStroke: “rgba(220,220,220,1)”,
  12.                     data: [scalingFactor(), scalingFactor(), scalingFactor(), scalingFactor(), scalingFactor(), scalingFactor(), scalingFactor()]
  13.                 },
  14.                 {
  15.                     label: “My Second dataset”,
  16.                     fillColor: “rgba(151,187,205,0.2)”,
  17.                     strokeColor: “rgba(151,187,205,1)”,
  18.                     pointColor: “rgba(151,187,205,1)”,
  19.                     pointStrokeColor: “#fff”,
  20.                     pointHighlightFill: “#fff”,
  21.                     pointHighlightStroke: “rgba(151,187,205,1)”,
  22.                     data: [scalingFactor(), scalingFactor(), scalingFactor(), scalingFactor(), scalingFactor(), scalingFactor(), scalingFactor()]
  23.                 }
  24.         ]
  25.     }

Properties

  • Labels
  • Datasets
    1. fillColor
    2. strokeColor
    3. pointColor
    4. pointStrokeColor
    5. pointHighlightFill
    6. pointHighlightStroke
    7. data

Here you can change the properties as you want.

To generate data

  1. var scalingFactor = function () { return Math.round(Math.random() * 100) };

Complete HTML

  1. <!DOCTYPE html>
  2. <html xmlns=“http://www.w3.org/1999/xhtml”>
  3. <head>
  4.     <title>Line Chart Using Chart.js</title>
  5.     <script src=“Chart.js”></script>
  6.     <script>
  7.     var scalingFactor = function () { return Math.round(Math.random() * 100) };
  8.     var lineChartData = {
  9.         labels: [“Monday”, “Tuesday”, “Wednesday”, “Thursday”, “Friday”, “Saturday”, “Sunday”],
  10.         datasets: [
  11.                 {
  12.                     fillColor: “rgba(220,220,220,0.2)”,
  13.                     strokeColor: “rgba(220,220,220,1)”,
  14.                     pointColor: “rgba(220,220,220,1)”,
  15.                     pointStrokeColor: “#fff”,
  16.                     pointHighlightFill: “#fff”,
  17.                     pointHighlightStroke: “rgba(220,220,220,1)”,
  18.                     data: [scalingFactor(), scalingFactor(), scalingFactor(), scalingFactor(), scalingFactor(), scalingFactor(), scalingFactor()]
  19.                 }
  20.         ]
  21.     }
  22.     window.onload = function () {
  23.         var canvasObject = document.getElementById(“myChart”).getContext(“2d”);
  24.         window.myLine = new Chart(canvasObject).Line(lineChartData, {
  25.             responsive: true
  26.         });
  27.     }
  28.     </script>
  29. </head>
  30. <body>
  31.     <div>
  32.         <canvas id=“myChart”></canvas>
  33.     </div>
  34. </body>
  35. </html>

Conclusion

I hope you have created your own chart.
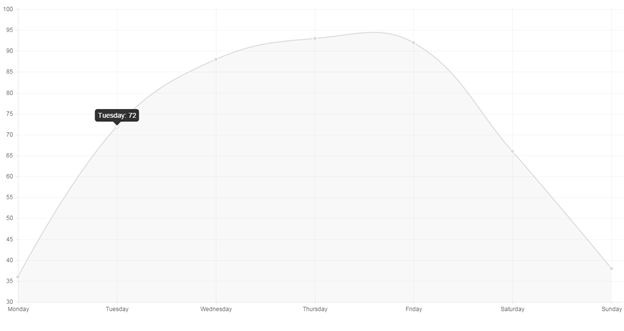
Output

Output

TagschartHTML5 ChartJQueryLine Chart
Previous Article

Client-Side Chart Widget in HTML 5: Part ...

Next Article

Client Side Chart Widget in HTML5: Part ...

0
Shares
  • 0
  • +
  • 0
  • 0
  • 0

SibeeshVenu

I am Sibeesh Venu, an engineer by profession and writer by passion. Microsoft MVP, Author, Speaker, Content Creator, Youtuber, Programmer.

Related articles More from author

  • HTMLJQuery

    Client-Side Chart Widget in HTML 5: Part 1 (Bar Chart)

    January 29, 2015
    By SibeeshVenu
  • Code SnippetsJQueryJson

    Parse a string to Json in JQuery

    May 31, 2015
    By SibeeshVenu
  • Code SnippetsJQuery

    Find and set checked true and call click event dynamically

    May 31, 2015
    By SibeeshVenu
  • HTML5

    Client-Side Chart Widget in HTML 5: Part 2 (Pie Chart)

    May 29, 2015
    By SibeeshVenu
  • JQueryJson

    Find JSON Objects With Same Property and Separate Them

    May 29, 2015
    By SibeeshVenu
  • Code SnippetsJQuery

    Round Off the number to two decimal places in jQuery

    May 31, 2015
    By SibeeshVenu
0

My book

Asp Net Core and Azure with Raspberry Pi Sibeesh Venu

YouTube

MICROSOFT MVP (2016-2022)

profile for Sibeesh Venu - Microsoft MVP

Recent Posts

  • Linux Azure Function Isolated Dot Net 9 YAML Template Deployment
  • Build, Deploy, Configure CI &CD Your Static Website in 5 mins
  • Easily move data from one COSMOS DB to another
  • .NET 8 New and Efficient Way to Check IP is in Given IP Range
  • Async Client IP safelist for Dot NET
  • Post Messages to Microsoft Teams Using Python
  • Get Azure Blob Storage Blob Metadata Using PowerShell
  • Deploy .net 6 App to Azure from Azure DevOps using Pipelines
  • Integrate Azure App Insights in 1 Minute to .Net6 Application
  • Azure DevOps Service Connection with Multiple Azure Resource Group

Tags

Achievements (35) Angular (14) Angular 5 (7) Angular JS (15) article (10) Article Of The Day (13) Asp.Net (14) Azure (65) Azure DevOps (10) Azure Function (10) Azure IoT (7) C# (17) c-sharp corner (13) Career Advice (11) chart (11) CSharp (7) CSS (7) CSS3 (6) HighChart (10) How To (9) HTML5 (10) HTML5 Chart (11) Interview (6) IoT (11) Javascript (10) JQuery (82) jquery functions (9) JQWidgets (15) JQX Grid (17) Json (7) Microsoft (8) MVC (20) MVP (9) MXChip (7) News (18) Office 365 (7) Products (10) SQL (20) SQL Server (15) Visual Studio (10) Visual Studio 2017 (7) VS2017 (7) Web API (12) Windows 10 (7) Wordpress (9)
  • .NET
  • Achievements
  • ADO.NET
  • Android
  • Angular
  • Arduino
  • Article Of The Day
  • ASP.NET
  • Asp.Net Core
  • Automobile
  • Awards
  • Azure
  • Azure CDN
  • azure devops
  • Blockchain
  • Blog
  • Browser
  • C-Sharp Corner
  • C#
  • Career Advice
  • Code Snippets
  • CodeProject
  • Cognitive Services
  • Cosmos DB
  • CSS
  • CSS3
  • Data Factory
  • Database
  • Docker
  • Drawings
  • Drill Down Chart
  • English
  • Excel Programming
  • Exporting
  • Facebook
  • Fun
  • Gadgets
  • GitHub
  • GoPro
  • High Map
  • HighChart
  • How to
  • HTML
  • HTML5
  • Ignite UI
  • IIS
  • Interview
  • IoT
  • JavaScript
  • JQuery
  • jQuery UI
  • JQWidgets
  • JQX Grid
  • Json
  • Knockout JS
  • Linux
  • Machine Learning
  • Malayalam
  • Malayalam Poems
  • MDX Query
  • Microsoft
  • Microsoft ADOMD
  • Microsoft MVP
  • Microsoft Office
  • Microsoft Technologies
  • Microsoft Windows
  • Microsoft Windows Server
  • Mobile
  • MongoDB
  • Monthly Winners
  • MVC
  • MVC Grid
  • MySQL
  • News
  • Node JS
  • npm
  • Number Conversions
  • October 2015
  • Office 365
  • Office Development
  • One Plus
  • Outlook
  • Page
  • PHP
  • Poems
  • PowerShell
  • Products
  • Q&A
  • Raspberry PI
  • React
  • SEO
  • SharePoint
  • Skype
  • Social Media
  • Software
  • Spire.Doc
  • Spire.PDF
  • Spire.XLS
  • SQL
  • SQL Server
  • SSAS
  • SSMS
  • Storage In HTML5
  • Stories
  • Third Party Software Apps
  • Tips
  • Tools
  • Translator Text
  • Uncategorized
  • Unit Testing
  • UWP
  • VB.Net
  • Videos
  • Virtual Machine
  • Visual Studio
  • Visual Studio 2017
  • Wamp Server
  • Web API
  • Web Platform Installer
  • Webinars
  • WebMatrix
  • Windows 10
  • Windows 7
  • Windows 8.1
  • Wordpress
  • Writing

ABOUT ME

I am Sibeesh Venu, an engineer by profession and writer by passion. Microsoft MVP, Author, Speaker, Content Creator, Youtuber, Programmer. If you would like to know more about me, you can read my story here.

Contact Me

  • info@sibeeshpassion.com

Pages

  • About
  • Search
  • Privacy Policy
  • About
  • Search
  • Privacy Policy
© Copyright Sibeesh Passion 2014-2025. All Rights Reserved.
Go to mobile version