Working With Bubble Map
In this post we will explain how to create a Bubble Map in our application.A Bubble Map is a tool for plotting the count or measure by country or any geo-locations in the map as a bubble. As the measure value increases, the bubble size will be increased, so we can get a live impression on what the data is. The only thing we need is, just the lat and long of those positions.
Background
A few days ago I got a requirement to implement a Bubble Map in my application. So I thought of sharing that with you all. Here we will see how to implement it in an easy way.
So Let Us Start. What you need first is to include the necessary JavaScript files. The required files are listed below.
[js]
<script src="Scripts/jquery-1.11.1.min.js"></script>
<script src="Scripts/highmaps.js"></script>
<script src="Scripts/proj4.js"></script>
<script src="Scripts/us-all.js"></script>
<script src="Scripts/world.js"></script>
[/js]
Once you are downloaded the files and provide the references, you are ready to go further. Now it is time to get our data that we need to populate in the Bubble Map. In this example I am using the following data.
[js]
var jsdata = [{ "State": "Arizona", "lat": "32.8796", "lon": "-111.7282", "Quantity": "29,248" }, { "State": "Arizona", "lat": "33.3197", "lon": "-111.9837", "Quantity": "102,928" }, { "State": "Arizona", "lat": "33.3939", "lon": "-111.6965", "Quantity": "108,863" }, { "State": "Arizona", "lat": "33.4495", "lon": "-112.3410", "Quantity": "67,218" }, { "State": "Arizona", "lat": "33.6155", "lon": "-111.9263", "Quantity": "66,556" }, { "State": "Arizona", "lat": "33.6384", "lon": "-112.2073", "Quantity": "147,552" }, { "State": "California", "lat": "33.6145", "lon": "-117.7101", "Quantity": "26,053" }, { "State": "California", "lat": "33.7008", "lon": "-117.9362", "Quantity": "26,057" }, { "State": "California", "lat": "33.7963", "lon": "-116.3845", "Quantity": "497,249" }, { "State": "California", "lat": "33.8274", "lon": "-118.0868", "Quantity": "32,052" }, { "State": "California", "lat": "33.8763", "lon": "-117.7418", "Quantity": "23,521" }, { "State": "California", "lat": "33.8996", "lon": "-118.3669", "Quantity": "26,169" }, { "State": "California", "lat": "34.0302", "lon": "-118.3865", "Quantity": "21,996" }, { "State": "California", "lat": "34.0569", "lon": "-117.2995", "Quantity": "59,135" }, { "State": "California", "lat": "34.0737", "lon": "-117.8859", "Quantity": "4,757" }, { "State": "California", "lat": "34.1820", "lon": "-118.3140", "Quantity": "28,909" }, { "State": "California", "lat": "34.2257", "lon": "-119.1551", "Quantity": "22,569" }, { "State": "California", "lat": "34.2300", "lon": "-118.5500", "Quantity": "22,413" }, { "State": "California", "lat": "34.4130", "lon": "-118.5036", "Quantity": "18,399" }, { "State": "California", "lat": "34.4813", "lon": "-117.3389", "Quantity": "23,268" }, { "State": "California", "lat": "34.6029", "lon": "-118.1464", "Quantity": "24,651" }, { "State": "California", "lat": "37.5038", "lon": "-121.9762", "Quantity": "4" }, { "State": "California", "lat": "38.3525", "lon": "-122.7148", "Quantity": "2" }, { "State": "Colorado", "lat": "38.4766", "lon": "-107.8812", "Quantity": "3,294" }, { "State": "Colorado", "lat": "39.0730", "lon": "-108.5710", "Quantity": "8,704" }, { "State": "Florida", "lat": "27.8400", "lon": "-82.6800", "Quantity": "75,066" }, { "State": "Florida", "lat": "27.9400", "lon": "-82.3200", "Quantity": "135,365" }, { "State": "Florida", "lat": "27.9600", "lon": "-82.3200", "Quantity": "-6" }, { "State": "Florida", "lat": "27.9925", "lon": "-82.7296", "Quantity": "27,274" }, { "State": "Florida", "lat": "28.0661", "lon": "-82.5688", "Quantity": "261" }, { "State": "Florida", "lat": "28.0790", "lon": "-80.6984", "Quantity": "15,720" }, { "State": "Florida", "lat": "28.0941", "lon": "-81.9738", "Quantity": "85,437" }, { "State": "Florida", "lat": "28.1918", "lon": "-82.3812", "Quantity": "97,233" }, { "State": "Florida", "lat": "28.3027", "lon": "-81.4216", "Quantity": "135,193" }, { "State": "Florida", "lat": "28.5622", "lon": "-81.2074", "Quantity": "120,424" }, { "State": "Florida", "lat": "28.6629", "lon": "-81.4176", "Quantity": "110,185" }, { "State": "Florida", "lat": "29.1800", "lon": "-81.0800", "Quantity": "66,725" }, { "State": "Georgia", "lat": "32.8100", "lon": "-83.7100", "Quantity": "3" }, { "State": "Georgia", "lat": "33.3671", "lon": "-84.7647", "Quantity": "87,508" }, { "State": "Georgia", "lat": "33.4600", "lon": "-84.2100", "Quantity": "155,811" }, { "State": "Georgia", "lat": "33.4759", "lon": "-82.0709", "Quantity": "10,875" }, { "State": "Georgia", "lat": "33.5600", "lon": "-84.5400", "Quantity": "17,937" }, { "State": "Georgia", "lat": "33.5610", "lon": "-84.3223", "Quantity": "203,297" }, { "State": "Georgia", "lat": "33.6810", "lon": "-84.1604", "Quantity": "134,700" }, { "State": "Georgia", "lat": "33.8200", "lon": "-84.3600", "Quantity": "122,120" }, { "State": "Georgia", "lat": "33.9168", "lon": "-83.4439", "Quantity": "84,648" }, { "State": "Georgia", "lat": "33.9522", "lon": "-84.1343", "Quantity": "105,862" }, { "State": "Georgia", "lat": "34.0051", "lon": "-84.5752", "Quantity": "-14" }, { "State": "Georgia", "lat": "34.0076", "lon": "-84.5769", "Quantity": "204,888" }, { "State": "Georgia", "lat": "34.0600", "lon": "-83.9800", "Quantity": "104,291" }, { "State": "Georgia", "lat": "34.1900", "lon": "-84.1200", "Quantity": "186,459" }, { "State": "Idaho", "lat": "42.9101", "lon": "-112.4605", "Quantity": "5,524" }, { "State": "Idaho", "lat": "43.6048", "lon": "-116.3496", "Quantity": "14,476" }, { "State": "Illinois", "lat": "41.5300", "lon": "-87.8500", "Quantity": "54,989" }, { "State": "Illinois", "lat": "41.7200", "lon": "-88.0300", "Quantity": "72,366" }, { "State": "Illinois", "lat": "42.0500", "lon": "-87.8300", "Quantity": "59,164" }, { "State": "Illinois", "lat": "42.1000", "lon": "-87.9700", "Quantity": "49,074" }, { "State": "Illinois", "lat": "42.1300", "lon": "-88.3300", "Quantity": "77,454" }, { "State": "Illinois", "lat": "42.2300", "lon": "-87.9300", "Quantity": "51,251" }, { "State": "Illinois", "lat": "42.2600", "lon": "-88.9700", "Quantity": "57,571" }, { "State": "Indiana", "lat": "39.6292", "lon": "-86.1252", "Quantity": "24,227" }, { "State": "Indiana", "lat": "39.6303", "lon": "-86.1249", "Quantity": "1,074" }, { "State": "Indiana", "lat": "39.7613", "lon": "-86.3488", "Quantity": "12,319" }, { "State": "Indiana", "lat": "39.7634", "lon": "-86.3489", "Quantity": "1,027" }, { "State": "Indiana", "lat": "40.0028", "lon": "-86.1227", "Quantity": "901" }, { "State": "Indiana", "lat": "41.4900", "lon": "-87.4700", "Quantity": "83,677" }, { "State": "Kentucky", "lat": "38.1438", "lon": "-85.6751", "Quantity": "-85" }];
[/js]
So our data is also ready now. Now we can check whether the populated data is correct or not. According to the Bubble Map, if any of the data is incorect then the map itself won’t load correctly. So it is always better to provide a check. I encountered many issues when doing this (because I was creating my data dynamically in my application), so I do not want it to happen in your case. You can use the following code for the check process.
[js]
$.each(jsdata, function (ix, entry)
{
if (Object.keys(entry).length >= 4)
{
tmp = entry[zPoint].replace(/\,/g, ”).replace(/\$/g, ”).replace(/\%/g, ”).replace(/\(/g, ”).replace(/\)/g, ”);
if (isNaN(tmp)) {
entry.z = entry[zPoint];
}
else {
}
data1.push(entry);
}
});
[/js]
Here what I am doing is checking whether all the data has the necessary properties. In our case it is 4 (State, Quantity, lat and lon) .
Now we will load the map as follows.
[js]
chart = $(‘#container’).highcharts(‘Map’, {
chart: {
borderWidth: 1
},
title: {
text: ‘Bubble map’
},
subtitle: {
text: ‘Bubble map sub title’
},
tooltip: {
pointFormat: ‘{point.State}: {point.Quantity}’
},
mapNavigation: {
enabled: true,
buttonOptions: {
verticalAlign: ‘bottom’
}
},
xAxis: {
},
yAxis: {
},
legend: {
enabled: true,
title: {
style: {
color: (Highcharts.theme && Highcharts.theme.textColor) || ‘black’
}
},
layout: ‘vertical’,
align: ‘right’,
verticalAlign: ‘bottom’,
floating: true,
valueDecimals: 0,
valueSuffix: ‘$’,
backgroundColor: (Highcharts.theme && Highcharts.theme.legendBackgroundColor) || ‘rgba(255, 255, 255, 0.85)’,
symbolRadius: 0,
symbolHeight: 14
},
series: [{
mapData: map,
borderColor: ‘#E0E0E0’,
colour: ‘#E0E0E0’,
showInLegend: false,
enableMouseTracking: true,
cursor: ‘pointer’,
dataLabels: {
enabled: true,
format: ‘{point.properties.postal-code}’,
textDecoration: ‘none’,
style: { "color": "darkgrey", "fontWeight": "bold", "HcTextStroke": "0px rgba(0,0,0,0.5)" }
},
events: {
click: function (e) {
e.point.zoomTo();
}
},
},
{
type: ‘mapbubble’,
color: ‘#E0E0E0’,
dataLabels: {
enabled: true,
formatter: function () {
}
},
enableMouseTracking: true,
joinBy: [‘iso-a2’, ‘code’],
name: zPoint,
data: data1,
minSize: $("#mapMinBubSize").val(),
maxSize: $("#mapMaxBubSize").val(),
color: $("#mapColor").val(),
displayNegative: true,
sizeBy: ‘width’,
cursor: ‘pointer’,
negativeColor: Highcharts.getOptions().colors[0]
}
],
chart: {
marginRight: 50
},
exporting: {
enabled: false
}
}
[/js]
In the preceding codes you can see we are taking the values from some UI elements (for examle $(“#mapMinBubSize”).val()). Don’t worry, we will see the settings option later. One more important thing is you can find a variable called zPoint in the preceding code, this is the value of our bubble. That is, according to the value of the zPoint the Map Bubble will increase or decrease.
[js]
var zPoint = "Quantity";
[/js]
In the next part , we will create a function for loading the map.
[js]
$(function () {
loadMap();
});
[/js]
Now it is time to write our complete code in that function.
[js]
function loadMap() {
var selectMap = $.trim($("#mapSelectMap").val());
var zPoint = "Quantity";
var jsdata = [{ "State": "Arizona", "lat": "32.8796", "lon": "-111.7282", "Quantity": "29,248" }, { "State": "Arizona", "lat": "33.3197", "lon": "-111.9837", "Quantity": "102,928" }, { "State": "Arizona", "lat": "33.3939", "lon": "-111.6965", "Quantity": "108,863" }, { "State": "Arizona", "lat": "33.4495", "lon": "-112.3410", "Quantity": "67,218" }, { "State": "Arizona", "lat": "33.6155", "lon": "-111.9263", "Quantity": "66,556" }, { "State": "Arizona", "lat": "33.6384", "lon": "-112.2073", "Quantity": "147,552" }, { "State": "California", "lat": "33.6145", "lon": "-117.7101", "Quantity": "26,053" }, { "State": "California", "lat": "33.7008", "lon": "-117.9362", "Quantity": "26,057" }, { "State": "California", "lat": "33.7963", "lon": "-116.3845", "Quantity": "497,249" }, { "State": "California", "lat": "33.8274", "lon": "-118.0868", "Quantity": "32,052" }, { "State": "California", "lat": "33.8763", "lon": "-117.7418", "Quantity": "23,521" }, { "State": "California", "lat": "33.8996", "lon": "-118.3669", "Quantity": "26,169" }, { "State": "California", "lat": "34.0302", "lon": "-118.3865", "Quantity": "21,996" }, { "State": "California", "lat": "34.0569", "lon": "-117.2995", "Quantity": "59,135" }, { "State": "California", "lat": "34.0737", "lon": "-117.8859", "Quantity": "4,757" }, { "State": "California", "lat": "34.1820", "lon": "-118.3140", "Quantity": "28,909" }, { "State": "California", "lat": "34.2257", "lon": "-119.1551", "Quantity": "22,569" }, { "State": "California", "lat": "34.2300", "lon": "-118.5500", "Quantity": "22,413" }, { "State": "California", "lat": "34.4130", "lon": "-118.5036", "Quantity": "18,399" }, { "State": "California", "lat": "34.4813", "lon": "-117.3389", "Quantity": "23,268" }, { "State": "California", "lat": "34.6029", "lon": "-118.1464", "Quantity": "24,651" }, { "State": "California", "lat": "37.5038", "lon": "-121.9762", "Quantity": "4" }, { "State": "California", "lat": "38.3525", "lon": "-122.7148", "Quantity": "2" }, { "State": "Colorado", "lat": "38.4766", "lon": "-107.8812", "Quantity": "3,294" }, { "State": "Colorado", "lat": "39.0730", "lon": "-108.5710", "Quantity": "8,704" }, { "State": "Florida", "lat": "27.8400", "lon": "-82.6800", "Quantity": "75,066" }, { "State": "Florida", "lat": "27.9400", "lon": "-82.3200", "Quantity": "135,365" }, { "State": "Florida", "lat": "27.9600", "lon": "-82.3200", "Quantity": "-6" }, { "State": "Florida", "lat": "27.9925", "lon": "-82.7296", "Quantity": "27,274" }, { "State": "Florida", "lat": "28.0661", "lon": "-82.5688", "Quantity": "261" }, { "State": "Florida", "lat": "28.0790", "lon": "-80.6984", "Quantity": "15,720" }, { "State": "Florida", "lat": "28.0941", "lon": "-81.9738", "Quantity": "85,437" }, { "State": "Florida", "lat": "28.1918", "lon": "-82.3812", "Quantity": "97,233" }, { "State": "Florida", "lat": "28.3027", "lon": "-81.4216", "Quantity": "135,193" }, { "State": "Florida", "lat": "28.5622", "lon": "-81.2074", "Quantity": "120,424" }, { "State": "Florida", "lat": "28.6629", "lon": "-81.4176", "Quantity": "110,185" }, { "State": "Florida", "lat": "29.1800", "lon": "-81.0800", "Quantity": "66,725" }, { "State": "Georgia", "lat": "32.8100", "lon": "-83.7100", "Quantity": "3" }, { "State": "Georgia", "lat": "33.3671", "lon": "-84.7647", "Quantity": "87,508" }, { "State": "Georgia", "lat": "33.4600", "lon": "-84.2100", "Quantity": "155,811" }, { "State": "Georgia", "lat": "33.4759", "lon": "-82.0709", "Quantity": "10,875" }, { "State": "Georgia", "lat": "33.5600", "lon": "-84.5400", "Quantity": "17,937" }, { "State": "Georgia", "lat": "33.5610", "lon": "-84.3223", "Quantity": "203,297" }, { "State": "Georgia", "lat": "33.6810", "lon": "-84.1604", "Quantity": "134,700" }, { "State": "Georgia", "lat": "33.8200", "lon": "-84.3600", "Quantity": "122,120" }, { "State": "Georgia", "lat": "33.9168", "lon": "-83.4439", "Quantity": "84,648" }, { "State": "Georgia", "lat": "33.9522", "lon": "-84.1343", "Quantity": "105,862" }, { "State": "Georgia", "lat": "34.0051", "lon": "-84.5752", "Quantity": "-14" }, { "State": "Georgia", "lat": "34.0076", "lon": "-84.5769", "Quantity": "204,888" }, { "State": "Georgia", "lat": "34.0600", "lon": "-83.9800", "Quantity": "104,291" }, { "State": "Georgia", "lat": "34.1900", "lon": "-84.1200", "Quantity": "186,459" }, { "State": "Idaho", "lat": "42.9101", "lon": "-112.4605", "Quantity": "5,524" }, { "State": "Idaho", "lat": "43.6048", "lon": "-116.3496", "Quantity": "14,476" }, { "State": "Illinois", "lat": "41.5300", "lon": "-87.8500", "Quantity": "54,989" }, { "State": "Illinois", "lat": "41.7200", "lon": "-88.0300", "Quantity": "72,366" }, { "State": "Illinois", "lat": "42.0500", "lon": "-87.8300", "Quantity": "59,164" }, { "State": "Illinois", "lat": "42.1000", "lon": "-87.9700", "Quantity": "49,074" }, { "State": "Illinois", "lat": "42.1300", "lon": "-88.3300", "Quantity": "77,454" }, { "State": "Illinois", "lat": "42.2300", "lon": "-87.9300", "Quantity": "51,251" }, { "State": "Illinois", "lat": "42.2600", "lon": "-88.9700", "Quantity": "57,571" }, { "State": "Indiana", "lat": "39.6292", "lon": "-86.1252", "Quantity": "24,227" }, { "State": "Indiana", "lat": "39.6303", "lon": "-86.1249", "Quantity": "1,074" }, { "State": "Indiana", "lat": "39.7613", "lon": "-86.3488", "Quantity": "12,319" }, { "State": "Indiana", "lat": "39.7634", "lon": "-86.3489", "Quantity": "1,027" }, { "State": "Indiana", "lat": "40.0028", "lon": "-86.1227", "Quantity": "901" }, { "State": "Indiana", "lat": "41.4900", "lon": "-87.4700", "Quantity": "83,677" }, { "State": "Kentucky", "lat": "38.1438", "lon": "-85.6751", "Quantity": "-85" }];
var data1 = [];
var tmp = ”;
var formatedVal = 0;
if (selectMap == "0") {
var H = Highcharts,
map = H.maps[‘countries/us/us-all’],
chart;
}
else {
var H = Highcharts,
map = H.maps[selectMap],
chart;
}
$.each(jsdata, function (ix, entry) {
if (Object.keys(entry).length >= 4) {
tmp = entry[zPoint].replace(/\,/g, ”).replace(/\$/g, ”).replace(/\%/g, ”).replace(/\(/g, ”).replace(/\)/g, ”);
if (isNaN(tmp)) {
entry.z = entry[zPoint];
}
else {
}
data1.push(entry);
}
});
chart = $(‘#container’).highcharts(‘Map’, {
chart: {
borderWidth: 1
},
title: {
text: ‘Bubble map’
},
subtitle: {
text: ‘Bubble map sub title’
},
tooltip: {
pointFormat: ‘{point.State}: {point.Quantity}’
},
mapNavigation: {
enabled: true,
buttonOptions: {
verticalAlign: ‘bottom’
}
},
xAxis: {
},
yAxis: {
},
legend: {
enabled: true,
title: {
style: {
color: (Highcharts.theme && Highcharts.theme.textColor) || ‘black’
}
},
layout: ‘vertical’,
align: ‘right’,
verticalAlign: ‘bottom’,
floating: true,
valueDecimals: 0,
valueSuffix: ‘$’,
backgroundColor: (Highcharts.theme && Highcharts.theme.legendBackgroundColor) || ‘rgba(255, 255, 255, 0.85)’,
symbolRadius: 0,
symbolHeight: 14
},
series: [{
mapData: map,
borderColor: ‘#E0E0E0’,
colour: ‘#E0E0E0’,
showInLegend: false,
enableMouseTracking: true,
cursor: ‘pointer’,
dataLabels: {
enabled: true,
format: ‘{point.properties.postal-code}’,
textDecoration: ‘none’,
style: { "color": "darkgrey", "fontWeight": "bold", "HcTextStroke": "0px rgba(0,0,0,0.5)" }
},
events: {
click: function (e) {
e.point.zoomTo();
}
},
},
{
type: ‘mapbubble’,
color: ‘#E0E0E0’,
dataLabels: {
enabled: true,
formatter: function () {
}
},
enableMouseTracking: true,
joinBy: [‘iso-a2’, ‘code’],
name: zPoint,
data: data1,
minSize: $("#mapMinBubSize").val(),
maxSize: $("#mapMaxBubSize").val(),
color: $("#mapColor").val(),
displayNegative: true,
sizeBy: ‘width’,
cursor: ‘pointer’,
negativeColor: Highcharts.getOptions().colors[0]
}
],
chart: {
marginRight: 50
},
exporting: {
enabled: false
}
});
}
[/js]
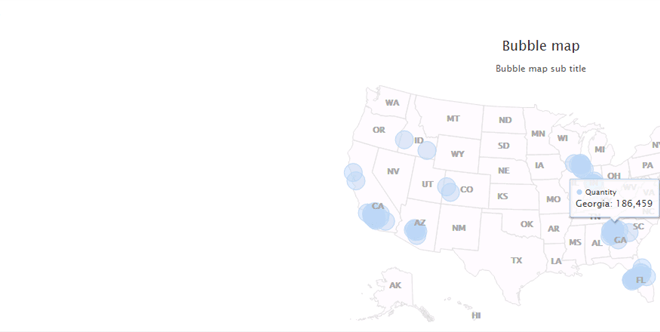
You can try giving a different setting or property to all the settings said above. Now if you run your code, you will get output as follows.
Create_Bubble_Map
I hope you got the output. In the preceding implementation, I have given my tooltip as:
[js]
tooltip: {
pointFormat: ‘{point.State}: {point.Quantity}’
},
[/js]
You can try various options there too. Here I am taking the values State and Quantity from the relevant point.
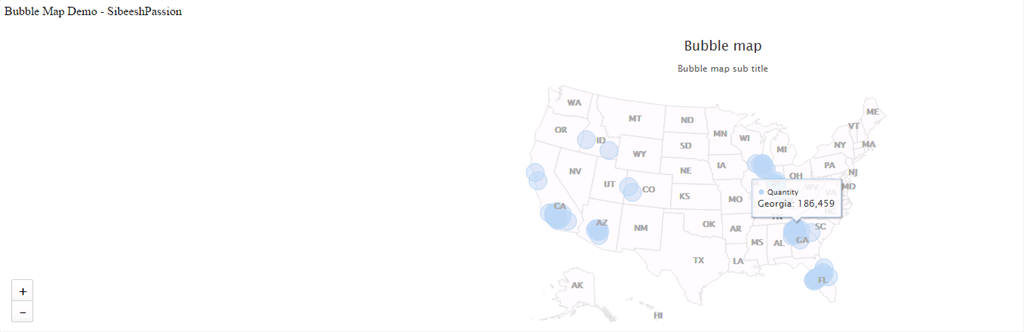
The next thing we will do is to create some UI elements. We will set the map bubble color, bubble size, background map and so on in these elements so that our application will be user-friendly.
Please add some UI elements as follows.
[html]
Bubble Map Demo – sibeeshpassion
<br />
<br />
<div id="container" style="min-width: 310px; height: 400px; margin: 0 auto"></div>
<label>Min Bubble Size</label>
<input type="number" value="8" min="1" id="mapMinBubSize" title="Type Bubble Min Size." />
<label>Max Bubble Size</label>
<input type="number" min="1" value="40" id="mapMaxBubSize" title="Type Bubble Max Size." />
<label>Color</label>
<input type="color" value="#BAD6F2" id="mapColor" title="Select Bubble Color." />
<label>Select Map</label>
<select name="tech" id="mapSelectMap" class="tech" title="Select Map.">
<option value="0">Select Map</option>
<option value="countries/us/us-all" selected="selected">US alone</option>
<option value="custom/world">Custom World</option>
</select>
<div id="apply" style="cursor: pointer; background-color: red; color: white; width: 100px; padding: 5px; float: right;">Apply Settings</div>
[/html]
Now you can see those elements in your screen, right?
Create_Bubble_Map
So we need to fire an event whenever the user clicks the apply settings button, right? Include the following code in your document ready function.
[js]
$(‘#apply’).click(function () {
loadMap();
});
[/js]
Now we will check whether our given settings are being applid to the map. Please see the following screenshot.
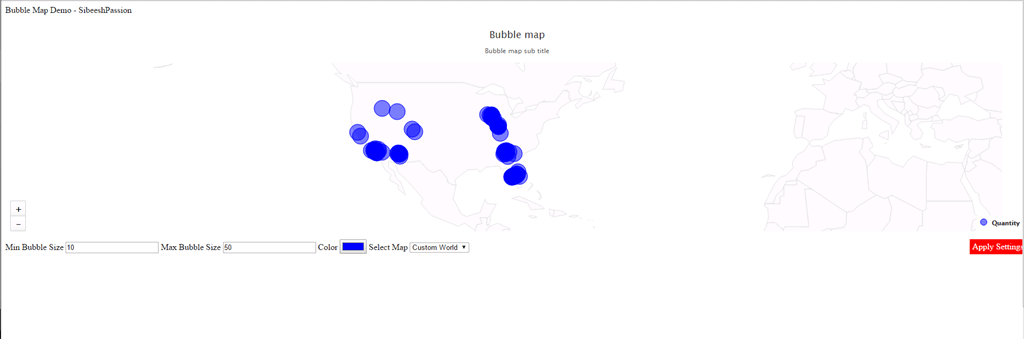
Now we have changed the bubble colour, bubble size and the map loaded in the background. Before the map was US alone one. Now it is the complete world.
Whenever the user changes the map we are checking it as follows.
[js]
var selectMap = $.trim($("#mapSelectMap").val());
if (selectMap == "0") {
var H = Highcharts,
map = H.maps[‘countries/us/us-all’],
chart;
}
else {
var H = Highcharts,
map = H.maps[selectMap],
chart;
}
[/js]
Can you find the differences?
Complete HTML
[html]
<!DOCTYPE html>
<html xmlns="http://www.w3.org/1999/xhtml">
<head>
<title>Bubble Map Demo – sibeeshpassion</title>
<script src="Scripts/jquery-1.11.1.min.js"></script>
<script src="Scripts/highmaps.js"></script>
<script src="Scripts/proj4.js"></script>
<script src="Scripts/us-all.js"></script>
<script src="Scripts/world.js"></script>
<script>
$(function () {
loadMap();
$(‘#apply’).click(function () {
loadMap();
});
});
function loadMap() {
var selectMap = $.trim($("#mapSelectMap").val());
var zPoint = "Quantity";
var jsdata = [{ "State": "Arizona", "lat": "32.8796", "lon": "-111.7282", "Quantity": "29,248" }, { "State": "Arizona", "lat": "33.3197", "lon": "-111.9837", "Quantity": "102,928" }, { "State": "Arizona", "lat": "33.3939", "lon": "-111.6965", "Quantity": "108,863" }, { "State": "Arizona", "lat": "33.4495", "lon": "-112.3410", "Quantity": "67,218" }, { "State": "Arizona", "lat": "33.6155", "lon": "-111.9263", "Quantity": "66,556" }, { "State": "Arizona", "lat": "33.6384", "lon": "-112.2073", "Quantity": "147,552" }, { "State": "California", "lat": "33.6145", "lon": "-117.7101", "Quantity": "26,053" }, { "State": "California", "lat": "33.7008", "lon": "-117.9362", "Quantity": "26,057" }, { "State": "California", "lat": "33.7963", "lon": "-116.3845", "Quantity": "497,249" }, { "State": "California", "lat": "33.8274", "lon": "-118.0868", "Quantity": "32,052" }, { "State": "California", "lat": "33.8763", "lon": "-117.7418", "Quantity": "23,521" }, { "State": "California", "lat": "33.8996", "lon": "-118.3669", "Quantity": "26,169" }, { "State": "California", "lat": "34.0302", "lon": "-118.3865", "Quantity": "21,996" }, { "State": "California", "lat": "34.0569", "lon": "-117.2995", "Quantity": "59,135" }, { "State": "California", "lat": "34.0737", "lon": "-117.8859", "Quantity": "4,757" }, { "State": "California", "lat": "34.1820", "lon": "-118.3140", "Quantity": "28,909" }, { "State": "California", "lat": "34.2257", "lon": "-119.1551", "Quantity": "22,569" }, { "State": "California", "lat": "34.2300", "lon": "-118.5500", "Quantity": "22,413" }, { "State": "California", "lat": "34.4130", "lon": "-118.5036", "Quantity": "18,399" }, { "State": "California", "lat": "34.4813", "lon": "-117.3389", "Quantity": "23,268" }, { "State": "California", "lat": "34.6029", "lon": "-118.1464", "Quantity": "24,651" }, { "State": "California", "lat": "37.5038", "lon": "-121.9762", "Quantity": "4" }, { "State": "California", "lat": "38.3525", "lon": "-122.7148", "Quantity": "2" }, { "State": "Colorado", "lat": "38.4766", "lon": "-107.8812", "Quantity": "3,294" }, { "State": "Colorado", "lat": "39.0730", "lon": "-108.5710", "Quantity": "8,704" }, { "State": "Florida", "lat": "27.8400", "lon": "-82.6800", "Quantity": "75,066" }, { "State": "Florida", "lat": "27.9400", "lon": "-82.3200", "Quantity": "135,365" }, { "State": "Florida", "lat": "27.9600", "lon": "-82.3200", "Quantity": "-6" }, { "State": "Florida", "lat": "27.9925", "lon": "-82.7296", "Quantity": "27,274" }, { "State": "Florida", "lat": "28.0661", "lon": "-82.5688", "Quantity": "261" }, { "State": "Florida", "lat": "28.0790", "lon": "-80.6984", "Quantity": "15,720" }, { "State": "Florida", "lat": "28.0941", "lon": "-81.9738", "Quantity": "85,437" }, { "State": "Florida", "lat": "28.1918", "lon": "-82.3812", "Quantity": "97,233" }, { "State": "Florida", "lat": "28.3027", "lon": "-81.4216", "Quantity": "135,193" }, { "State": "Florida", "lat": "28.5622", "lon": "-81.2074", "Quantity": "120,424" }, { "State": "Florida", "lat": "28.6629", "lon": "-81.4176", "Quantity": "110,185" }, { "State": "Florida", "lat": "29.1800", "lon": "-81.0800", "Quantity": "66,725" }, { "State": "Georgia", "lat": "32.8100", "lon": "-83.7100", "Quantity": "3" }, { "State": "Georgia", "lat": "33.3671", "lon": "-84.7647", "Quantity": "87,508" }, { "State": "Georgia", "lat": "33.4600", "lon": "-84.2100", "Quantity": "155,811" }, { "State": "Georgia", "lat": "33.4759", "lon": "-82.0709", "Quantity": "10,875" }, { "State": "Georgia", "lat": "33.5600", "lon": "-84.5400", "Quantity": "17,937" }, { "State": "Georgia", "lat": "33.5610", "lon": "-84.3223", "Quantity": "203,297" }, { "State": "Georgia", "lat": "33.6810", "lon": "-84.1604", "Quantity": "134,700" }, { "State": "Georgia", "lat": "33.8200", "lon": "-84.3600", "Quantity": "122,120" }, { "State": "Georgia", "lat": "33.9168", "lon": "-83.4439", "Quantity": "84,648" }, { "State": "Georgia", "lat": "33.9522", "lon": "-84.1343", "Quantity": "105,862" }, { "State": "Georgia", "lat": "34.0051", "lon": "-84.5752", "Quantity": "-14" }, { "State": "Georgia", "lat": "34.0076", "lon": "-84.5769", "Quantity": "204,888" }, { "State": "Georgia", "lat": "34.0600", "lon": "-83.9800", "Quantity": "104,291" }, { "State": "Georgia", "lat": "34.1900", "lon": "-84.1200", "Quantity": "186,459" }, { "State": "Idaho", "lat": "42.9101", "lon": "-112.4605", "Quantity": "5,524" }, { "State": "Idaho", "lat": "43.6048", "lon": "-116.3496", "Quantity": "14,476" }, { "State": "Illinois", "lat": "41.5300", "lon": "-87.8500", "Quantity": "54,989" }, { "State": "Illinois", "lat": "41.7200", "lon": "-88.0300", "Quantity": "72,366" }, { "State": "Illinois", "lat": "42.0500", "lon": "-87.8300", "Quantity": "59,164" }, { "State": "Illinois", "lat": "42.1000", "lon": "-87.9700", "Quantity": "49,074" }, { "State": "Illinois", "lat": "42.1300", "lon": "-88.3300", "Quantity": "77,454" }, { "State": "Illinois", "lat": "42.2300", "lon": "-87.9300", "Quantity": "51,251" }, { "State": "Illinois", "lat": "42.2600", "lon": "-88.9700", "Quantity": "57,571" }, { "State": "Indiana", "lat": "39.6292", "lon": "-86.1252", "Quantity": "24,227" }, { "State": "Indiana", "lat": "39.6303", "lon": "-86.1249", "Quantity": "1,074" }, { "State": "Indiana", "lat": "39.7613", "lon": "-86.3488", "Quantity": "12,319" }, { "State": "Indiana", "lat": "39.7634", "lon": "-86.3489", "Quantity": "1,027" }, { "State": "Indiana", "lat": "40.0028", "lon": "-86.1227", "Quantity": "901" }, { "State": "Indiana", "lat": "41.4900", "lon": "-87.4700", "Quantity": "83,677" }, { "State": "Kentucky", "lat": "38.1438", "lon": "-85.6751", "Quantity": "-85" }];
var data1 = [];
var tmp = ”;
var formatedVal = 0;
if (selectMap == "0") {
var H = Highcharts,
map = H.maps[‘countries/us/us-all’],
chart;
}
else {
var H = Highcharts,
map = H.maps[selectMap],
chart;
}
$.each(jsdata, function (ix, entry) {
if (Object.keys(entry).length >= 4) {
tmp = entry[zPoint].replace(/\,/g, ”).replace(/\$/g, ”).replace(/\%/g, ”).replace(/\(/g, ”).replace(/\)/g, ”);
if (isNaN(tmp)) {
entry.z = entry[zPoint];
}
else {
}
data1.push(entry);
}
});
chart = $(‘#container’).highcharts(‘Map’, {
chart: {
borderWidth: 1
},
title: {
text: ‘Bubble map’
},
subtitle: {
text: ‘Bubble map sub title’
},
tooltip: {
pointFormat: ‘{point.State}: {point.Quantity}’
},
mapNavigation: {
enabled: true,
buttonOptions: {
verticalAlign: ‘bottom’
}
},
xAxis: {
},
yAxis: {
},
legend: {
enabled: true,
title: {
style: {
color: (Highcharts.theme && Highcharts.theme.textColor) || ‘black’
}
},
layout: ‘vertical’,
align: ‘right’,
verticalAlign: ‘bottom’,
floating: true,
valueDecimals: 0,
valueSuffix: ‘$’,
backgroundColor: (Highcharts.theme && Highcharts.theme.legendBackgroundColor) || ‘rgba(255, 255, 255, 0.85)’,
symbolRadius: 0,
symbolHeight: 14
},
series: [{
mapData: map,
borderColor: ‘#E0E0E0’,
colour: ‘#E0E0E0’,
showInLegend: false,
enableMouseTracking: true,
cursor: ‘pointer’,
dataLabels: {
enabled: true,
format: ‘{point.properties.postal-code}’,
textDecoration: ‘none’,
style: { "color": "darkgrey", "fontWeight": "bold", "HcTextStroke": "0px rgba(0,0,0,0.5)" }
},
events: {
click: function (e) {
e.point.zoomTo();
}
},
},
{
type: ‘mapbubble’,
color: ‘#E0E0E0’,
dataLabels: {
enabled: true,
formatter: function () {
}
},
enableMouseTracking: true,
joinBy: [‘iso-a2’, ‘code’],
name: zPoint,
data: data1,
minSize: $("#mapMinBubSize").val(),
maxSize: $("#mapMaxBubSize").val(),
color: $("#mapColor").val(),
displayNegative: true,
sizeBy: ‘width’,
cursor: ‘pointer’,
negativeColor: Highcharts.getOptions().colors[0]
}
],
chart: {
marginRight: 50
},
exporting: {
enabled: false
}
});
}
</script>
</head>
<body>
Bubble Map Demo – sibeeshpassion
<br />
<br />
<div id="container" style="min-width: 310px; height: 400px; margin: 0 auto"></div>
<label>Min Bubble Size</label>
<input type="number" value="8" min="1" id="mapMinBubSize" title="Type Bubble Min Size." />
<label>Max Bubble Size</label>
<input type="number" min="1" value="40" id="mapMaxBubSize" title="Type Bubble Max Size." />
<label>Color</label>
<input type="color" value="#BAD6F2" id="mapColor" title="Select Bubble Color." />
<label>Select Map</label>
<select name="tech" id="mapSelectMap" class="tech" title="Select Map.">
<option value="0">Select Map</option>
<option value="countries/us/us-all" selected="selected">US alone</option>
<option value="custom/world">Custom World</option>
</select>
<div id="apply" style="cursor: pointer; background-color: red; color: white; width: 100px; padding: 5px; float: right;">Apply Settings</div>
</body>
</html>
[/html]
Conclusion
Please download the source code for more details. I hope you liked this article. Now please share your thoughts and suggestions. It matters a lot.
Kindest Regards
Sibeesh Venu